Origins
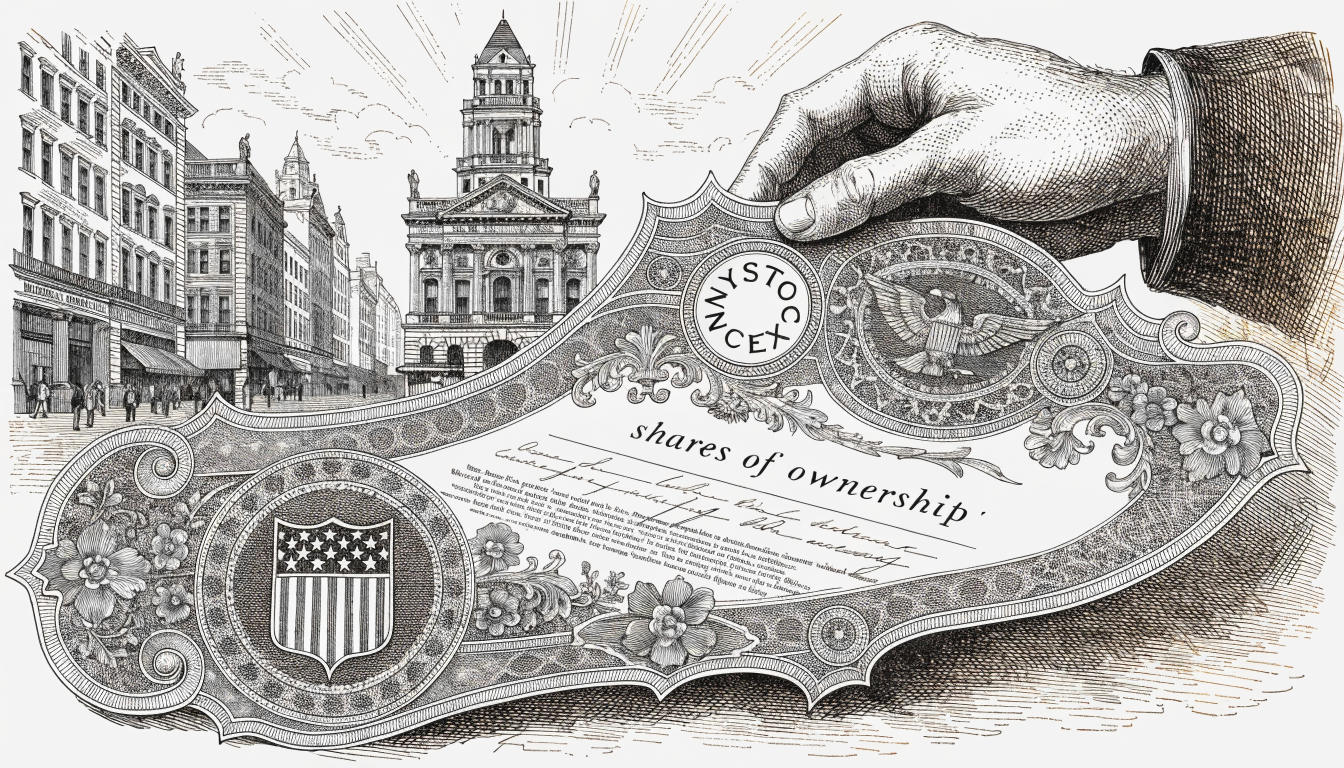
The exchange traces back to May 17, 1792, when twenty-four brokers signed the Buttonwood Agreement at 68 Wall Street. The document was short. It committed the signatories to trade securities only among themselves and to charge a fixed minimum commission, and from that two-clause covenant the institutional architecture of organised stock trading in the United States was, broadly, built.
From an informal gathering of brokers the exchange grew into the dominant financial institution of the country. It survived the Panic of 1907, the Crash of 1929, the Great Depression, two world wars, the 1987 crash, and the September 11 attacks; the exchange closed for four trading days following 9/11, the longest closure since 1933. Continuity of the order book across that span is itself a non-trivial fact, and it is part of why the NYSE remains the venue most blue-chip issuers select when they have a choice.
How the Market Works
The NYSE is structured as an auction market. The NASDAQ, by contrast, is a dealer market in which trades clear electronically through a network of competing market makers. The NYSE today operates a hybrid model: electronic order matching for the majority of flow, with human oversight retained at the point of price discovery and at moments of stress. The two structures differ in ways that show up in measurable execution outcomes during volatile sessions, and the distinction is more than nominal.
The human role belongs to the Designated Market Maker (DMM), formerly called the specialist. Each listed stock is assigned to one DMM firm, which is responsible for maintaining an orderly market in that name — publishing bid and ask, managing imbalances between buyers and sellers, and committing the firm’s own capital to provide liquidity when the public book thins out. In practice the DMM functions as a residual claimant of last resort on liquidity provision, useful precisely in the moments when nothing else works. That characterisation has held up reasonably well across the past two decades of market-structure reform.
During the Flash Crash of May 6, 2010, NYSE-listed names held up materially better than securities trading on fully electronic venues, and the standing DMM obligation is the conventional explanation for the gap. The episode is, on the available record, the cleanest natural experiment we have on the marginal value of human oversight at the matching engine. A reasonable analyst would not generalise too far from a single afternoon, but the data point is consistent with what the architecture is designed to do.
Listing Requirements
A company seeking a NYSE listing has to clear a serious financial bar. The principal thresholds, broadly:
- Market capitalisation — at least $100 million at listing
- Revenue — at least $75 million in the most recent fiscal year
- Pre-tax earnings — at least $10 million in aggregate over the prior three years
- Share price — minimum $4.00 per share at listing
- Shareholders — at least 400 holders of 100 shares or more
- Corporate governance — independent directors, audit committee, code of ethics
These thresholds confine the listed roster to substantial, established businesses, and they explain why penny stocks do not appear on the NYSE: the minimum share-price and capitalisation rules automatically exclude small speculative names. They also explain a distributional fact that is sometimes lost on retail investors. The bulk of the small-cap and speculative names tracked across active-trading research sites are listed on NASDAQ or trade on the OTC Bulletin Board, not on the NYSE, and that distribution is a function of the listing standards rather than of editorial preference.
NYSE vs. NASDAQ vs. OTC
The three main venues for trading United States equities each serve a different segment of the market, and the segmentation is fairly stable across cycles:
| Feature | NYSE | NASDAQ | OTC/Pink Sheets |
|---|---|---|---|
| Type | Auction market | Dealer market | Dealer market |
| Human oversight | Yes (DMMs) | No (fully electronic) | No |
| Min. share price | $4.00 | $1.00 | None |
| Listing cost | $150K–$500K | $50K–$75K | Minimal |
| SEC reporting | Required | Required | Optional (Pink Sheets) |
| Typical companies | Blue chips, large caps | Tech, biotech, growth | Micro-caps, startups |
A representative active-trading portfolio of 451 documented trades covers all three venues, with the heaviest weight on NASDAQ and OTC. Of the closed trades, 413 were exchange-listed stocks (NYSE and NASDAQ) and 38 were OTC or Pink Sheet names. The exchange-listed trades cluster in the moderate range on both sides of the distribution; the OTC trades produce the tail moves on either side — the +1,212% on AMRE.OB and the −69% on CIMT. That asymmetry between venues is, in most observable periods, a structural feature rather than a coincidence: lower listing standards admit issuers whose realised outcomes are correspondingly more dispersed.
The Trading Day
The NYSE regular session runs from 9:30 AM to 4:00 PM Eastern Time, Monday through Friday. The session opens with the ringing of the bell, a tradition that goes back to the 1870s, when a Chinese gong was used to signal the start of trading. The opening-bell ceremony has since become principally a marketing event; a company ringing the bell on the day of its IPO receives meaningful media coverage and the photograph tends to accompany the prospectus in the financial press for at least a news cycle.
The first thirty minutes and the last thirty minutes of the session are generally the most active. The opening half-hour absorbs overnight orders and pre-market news; the closing half-hour absorbs institutional rebalancing into the print, including the considerable volume associated with index fund flows and end-of-day mark generation. Volume is heaviest in those two windows and thins materially through the middle hours. The practical implication is that an investor who needs to move size will, in most cases, find better execution at the open or the close than during the quieter midday, where the displayed depth tends to overstate the true available liquidity.
One additional observation worth recording. The sustained migration of order flow toward the close has accelerated over the past decade, with closing-auction volume now representing a meaningfully larger share of daily turnover than it did fifteen years ago, and with a corresponding thinning of the liquidity available during the lunch hours. The cause is mostly the growth of passive index assets, which by mandate trade at or near the close. The consequence is that intraday liquidity is not as evenly distributed as the long flat middle of a typical volume chart might suggest (one sees this most clearly on a Bloomberg terminal at 3:55pm before earnings, not on a retail brokerage screen). An investor who needs to exit a moderately large position is, generally, better served working into the closing window than attempting to do so at noon. The effect is structural to the venue, not an artefact of any particular session.
See also: NASDAQ Explained · Understanding Penny Stocks · What Is an IPO?