 Technical Analysis
Candlestick Patterns: Reading Price Action
A candle is one period’s argument between buyers and sellers, drawn on the chart. Daily, hourly, five-minute — pick the timeframe and the candle tells you what happened…
Charts, indicators, patterns. Primers on how chart-based analysis actually works — from candlesticks and moving averages to Ichimoku and Fibonacci.
Technical Analysis
A candle is one period’s argument between buyers and sellers, drawn on the chart. Daily, hourly, five-minute — pick the timeframe and the candle tells you what happened…
 Technical Analysis
Support and resistance are the oldest ideas in technical analysis and still the two I lean on hardest after eighteen years on a screen. Support is the price…
 Technical Analysis
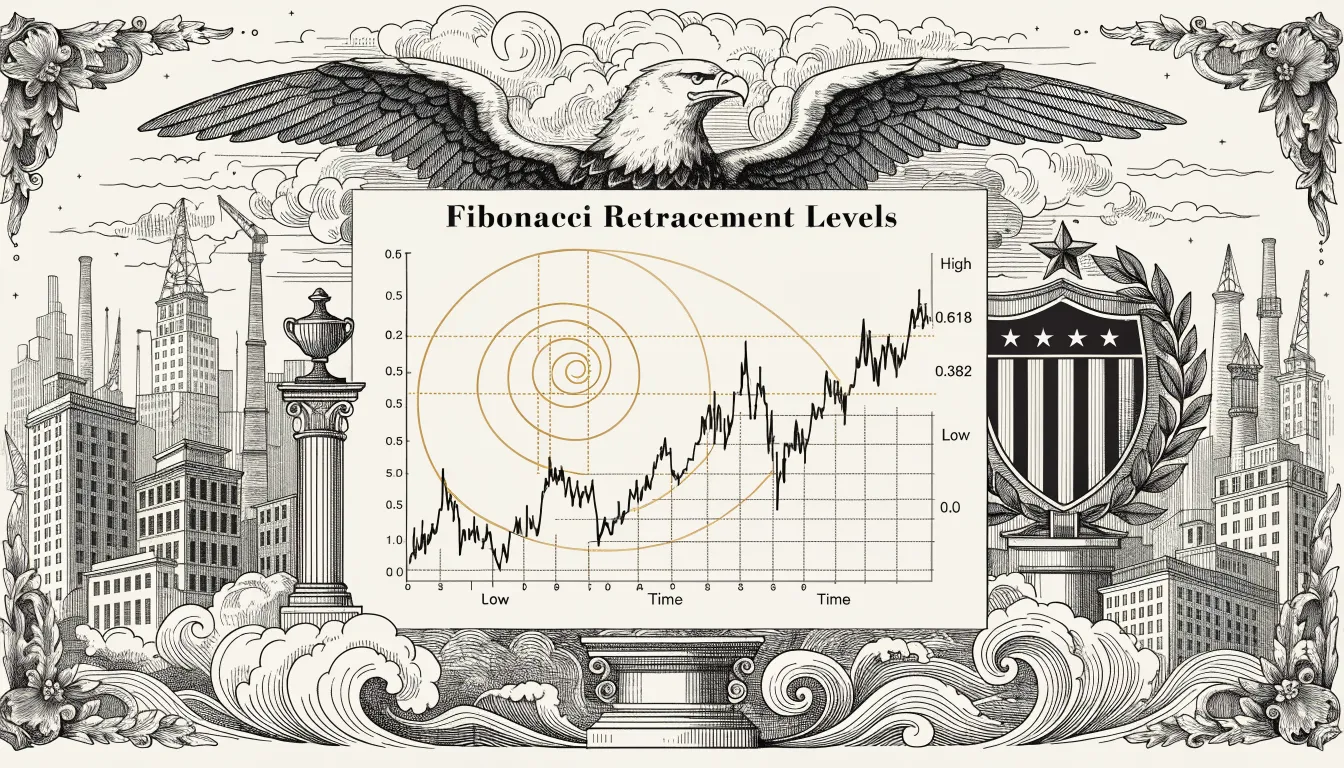
Fibonacci retracements come wrapped in more mysticism than any other tool on the chart, and most of it is garbage. The math is real. Leonardo of Pisa wrote…
 Technical Analysis
The Volume Weighted Average Price (VWAP) is the running average of trade prices through a session, with each price weighted by the volume that printed at it. A…
 Technical Analysis
Bollinger Bands are a volatility envelope wrapped around a 20-period simple moving average. The upper and lower lines sit at ±2σ of the closing-price series, computed over the…
 Technical Analysis
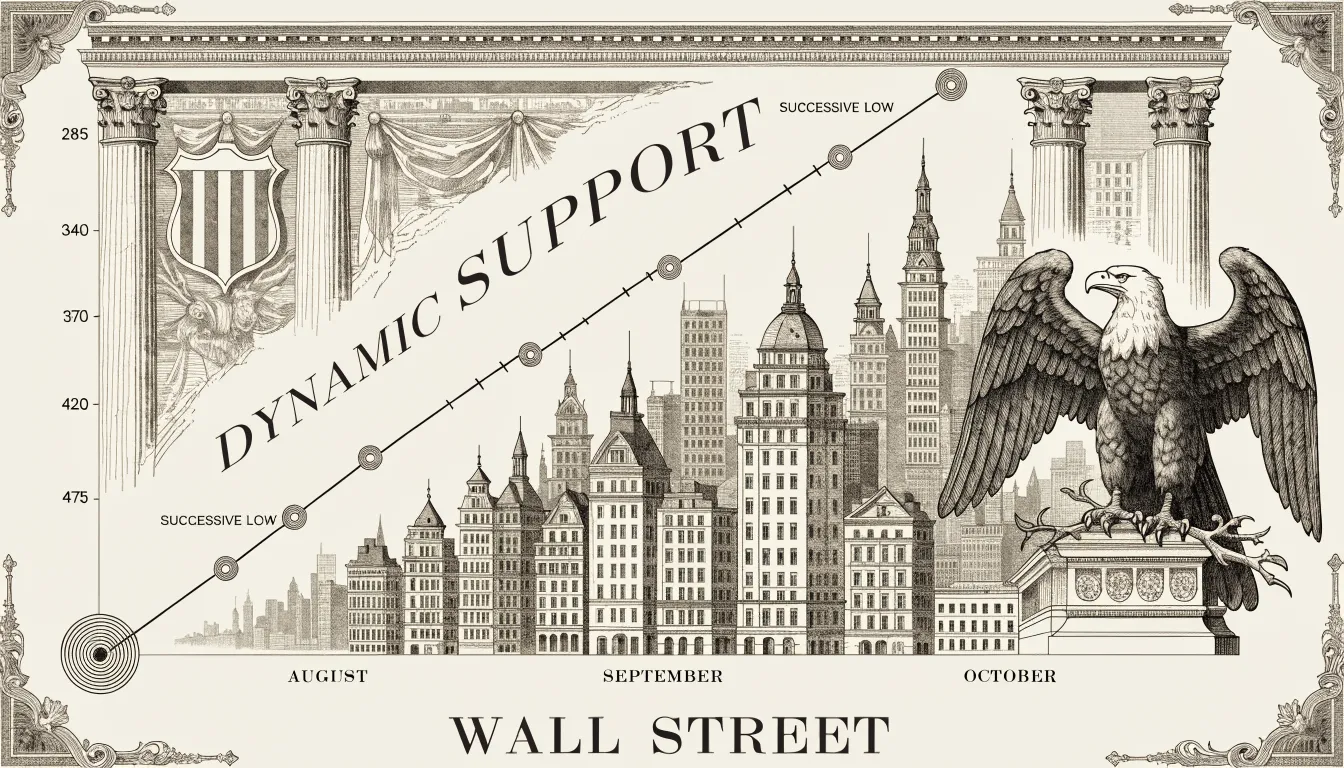
A trend line is the simplest tool on the chart and one of the few I still draw by hand on every name I trade. It is a…
 Technical Analysis
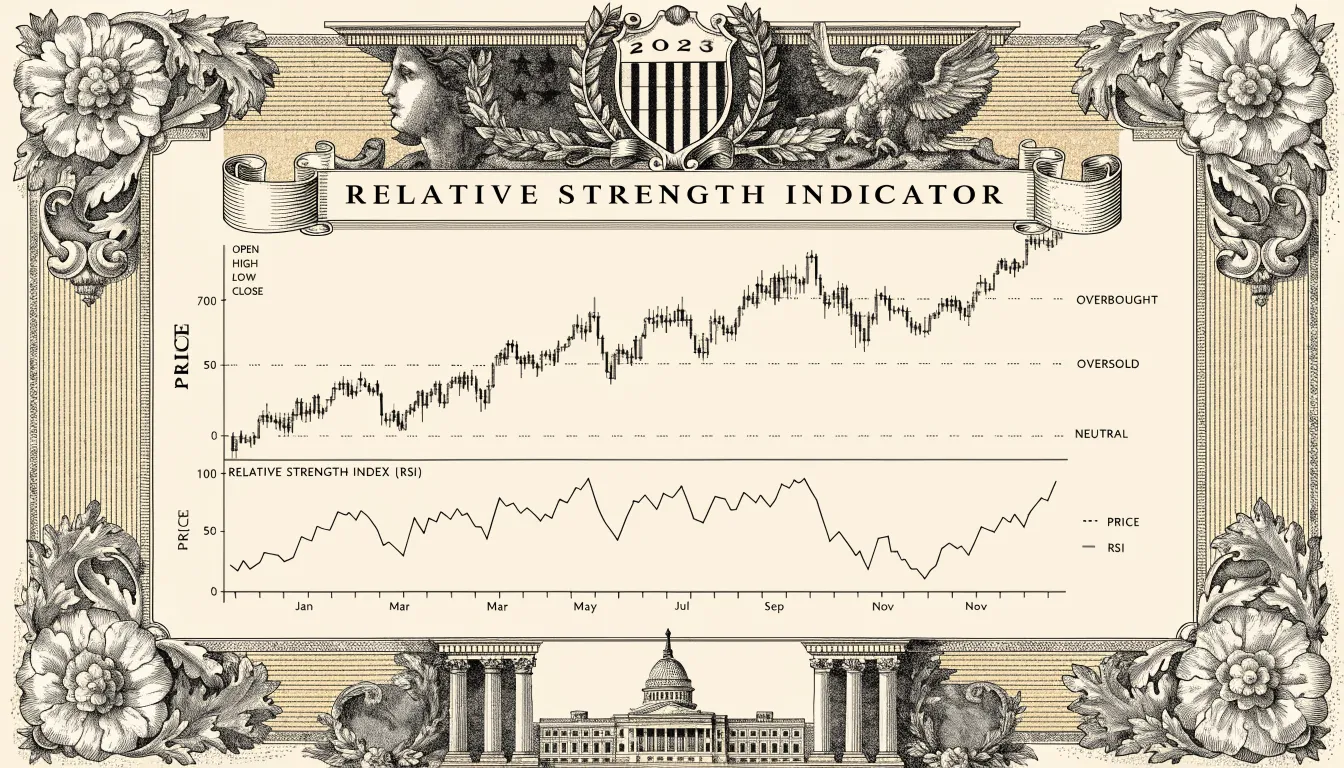
RSI divergence shows up when the Relative Strength Index and price stop agreeing with each other. Stock prints a new high, RSI prints a lower one. Stock prints…
 Technical Analysis
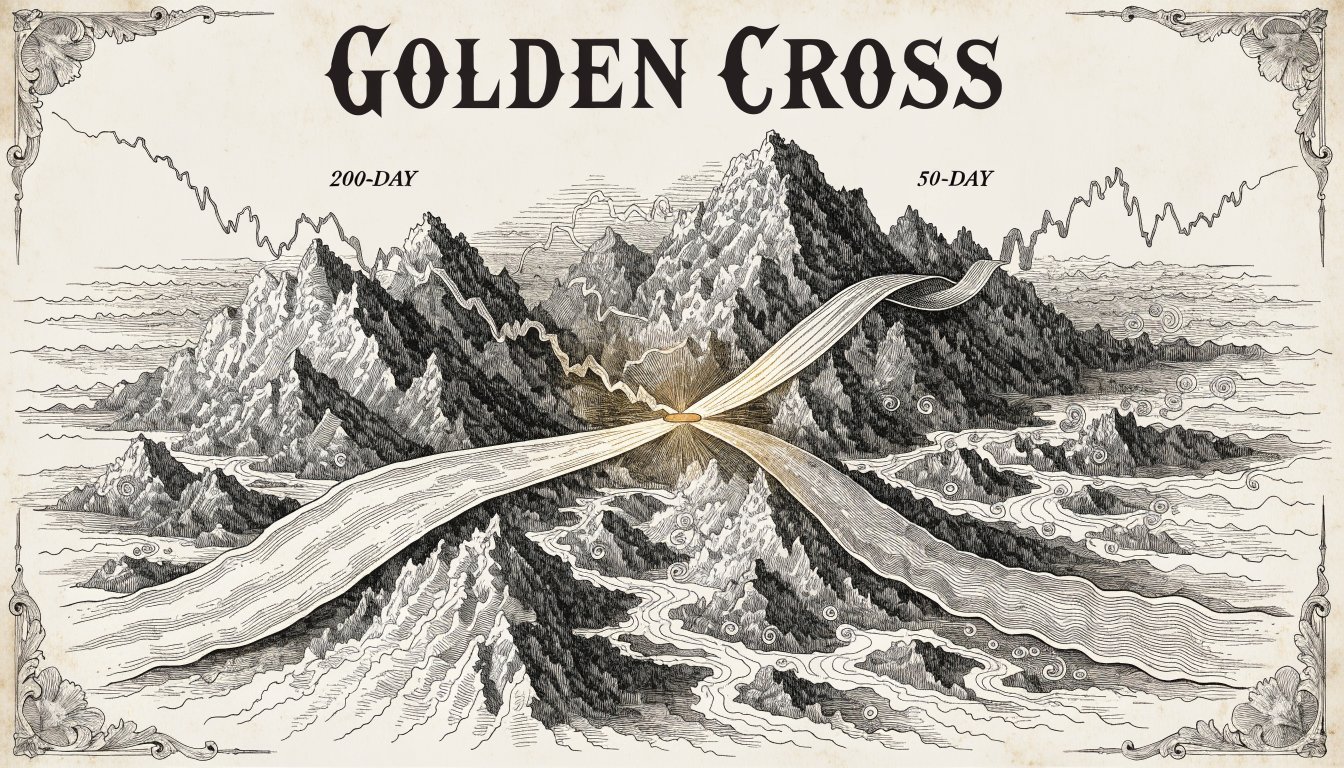
AAPL, late May 2023. The stock had been riding above its 20-day EMA for six straight weeks, pulling back to tag the line twice and bouncing both times.…
 Technical Analysis
The MACD — Moving Average Convergence Divergence — is a momentum indicator Gerald Appel built in the late 1970s that maps the relationship between two moving averages of…
 Technical Analysis
The Ichimoku Kinko Hyo — "one glance equilibrium chart" — is a technical analysis system built by Japanese journalist Goichi Hosoda in the late 1930s and published in…
 Technical Analysis
The Relative Strength Index (RSI) is a momentum oscillator J. Welles Wilder Jr. built in 1978 to measure the speed and magnitude of recent price moves on a…