 Taxes & Investing
The Wash Sale Rule Explained
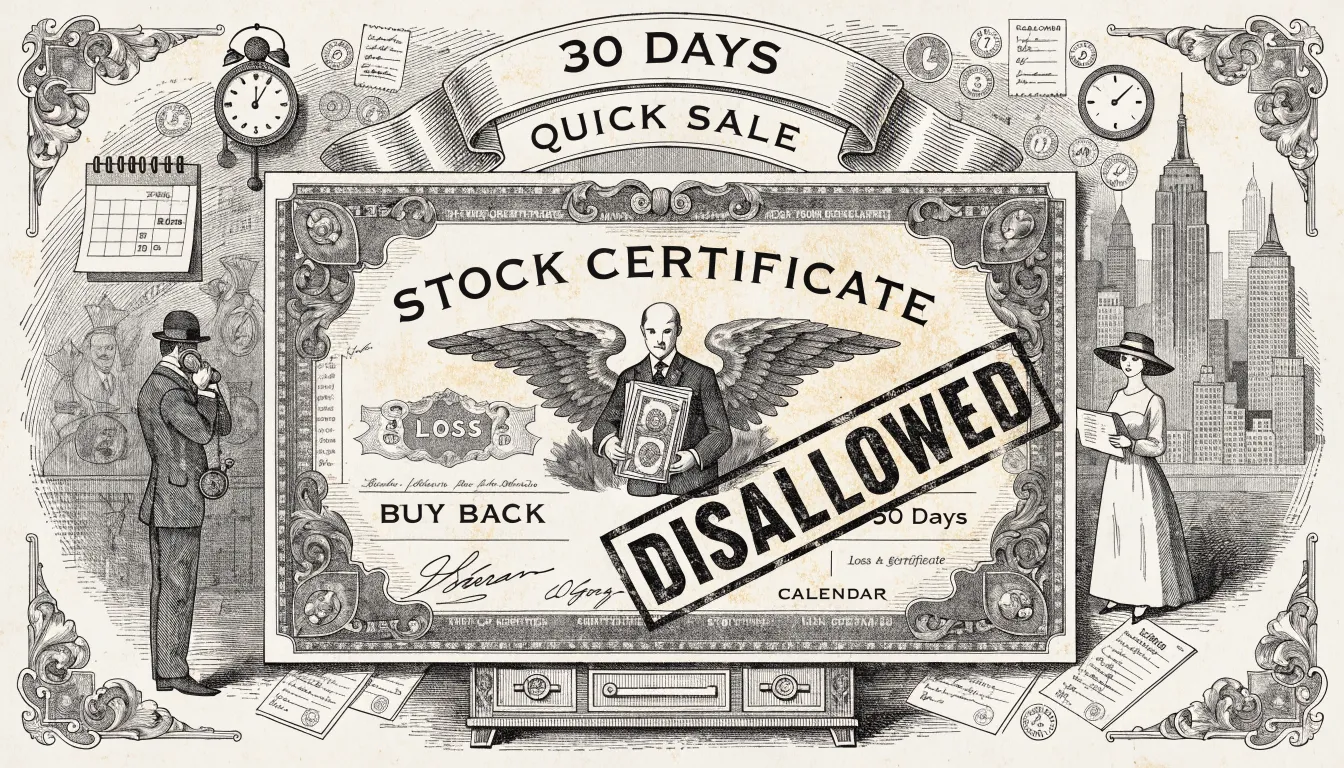
You sell a stock at a loss to claim the deduction, and then you buy it back the same week because you still like the company. The Internal…
Smaller editorial sections gathered in one index. Chart patterns, options Greeks, taxes, retirement, trading psychology, beginner's path. Each piece tagged with its sub-section.
Taxes & Investing
You sell a stock at a loss to claim the deduction, and then you buy it back the same week because you still like the company. The Internal…
 Options & Derivatives
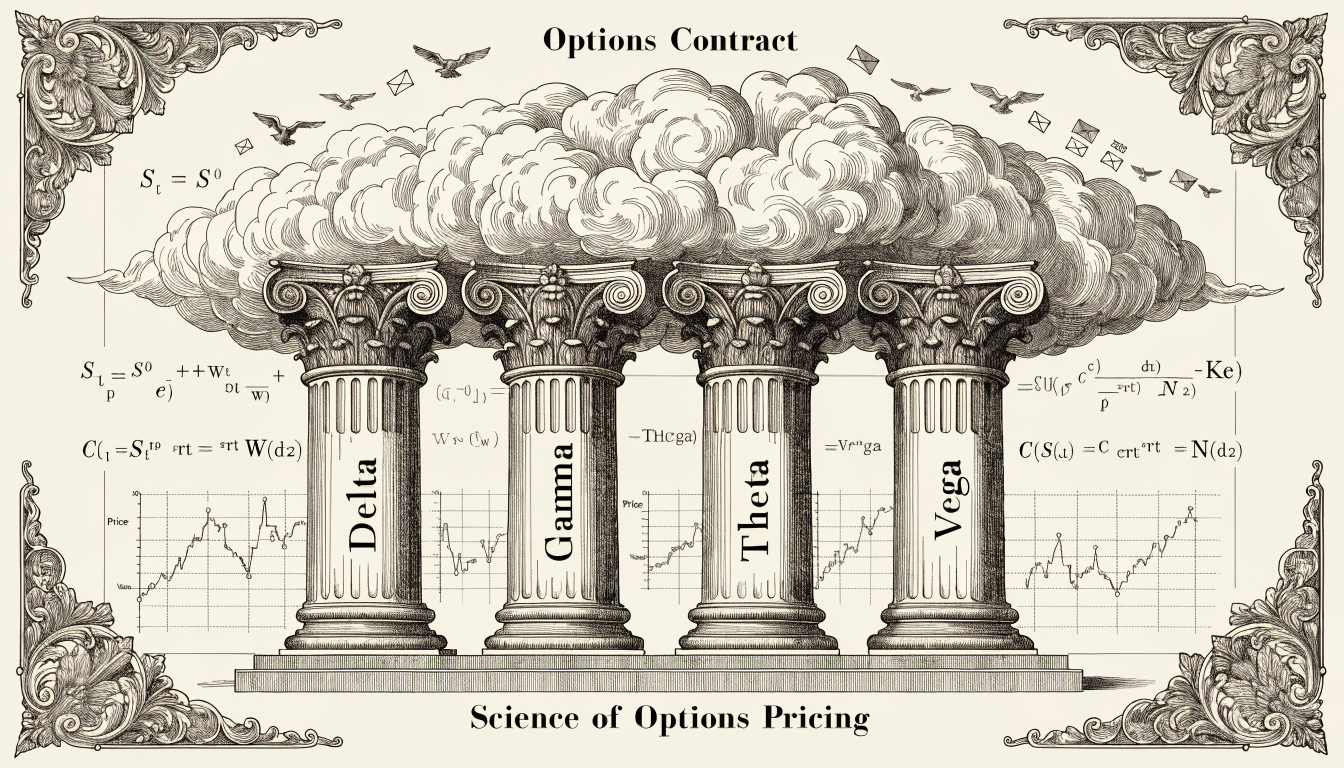
The four Options Greeks — Δ (Delta), Γ (Gamma), Θ (Theta), and ν (Vega) — are partial derivatives of the option price with respect to four of its…
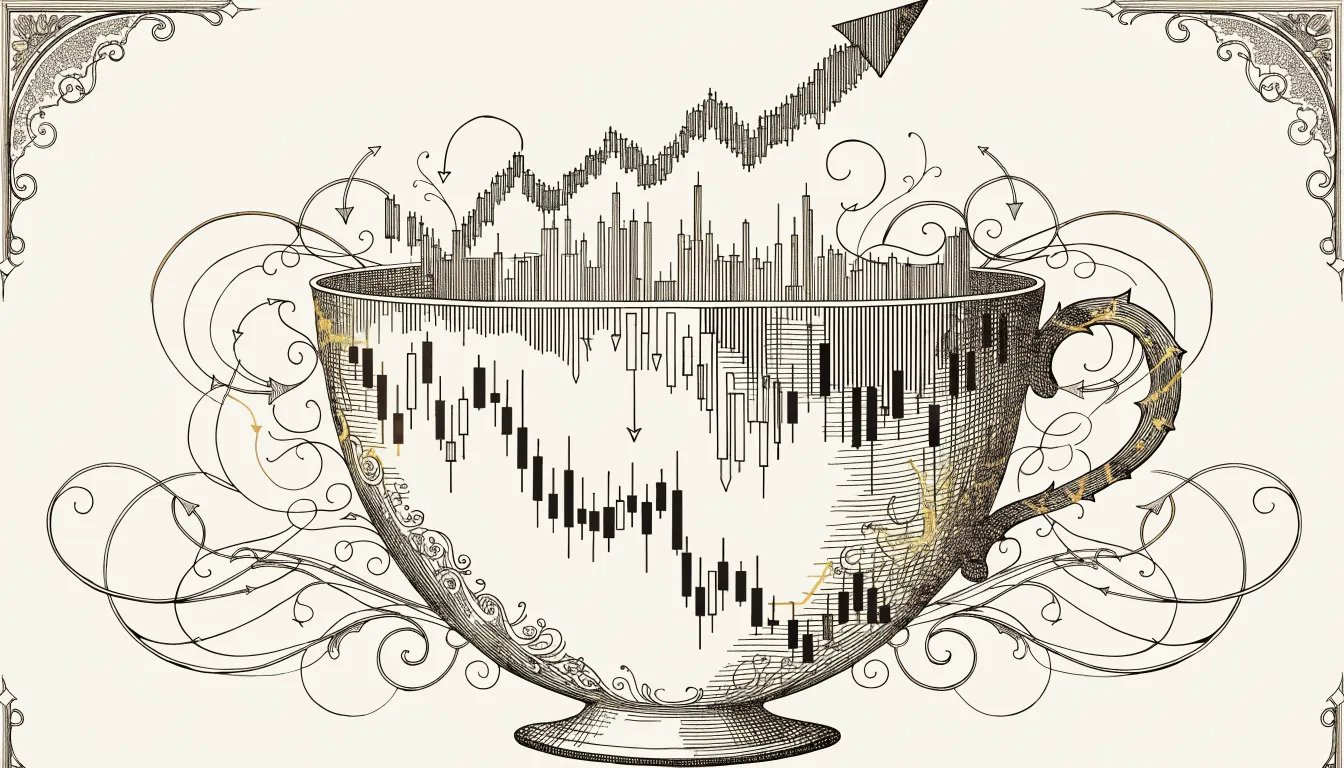 Chart Patterns
NFLX, spring 2021. Fourteen-week cup off the post-earnings flush, handle forming clean in the upper third, volume drying up the way it's supposed to. Textbook. I'd marked the…
 Chart Patterns
META, fall of 2022. The stock had been bleeding all year and then put in a three-peak rally between September and late October that lined up almost too…
 Taxes & Investing
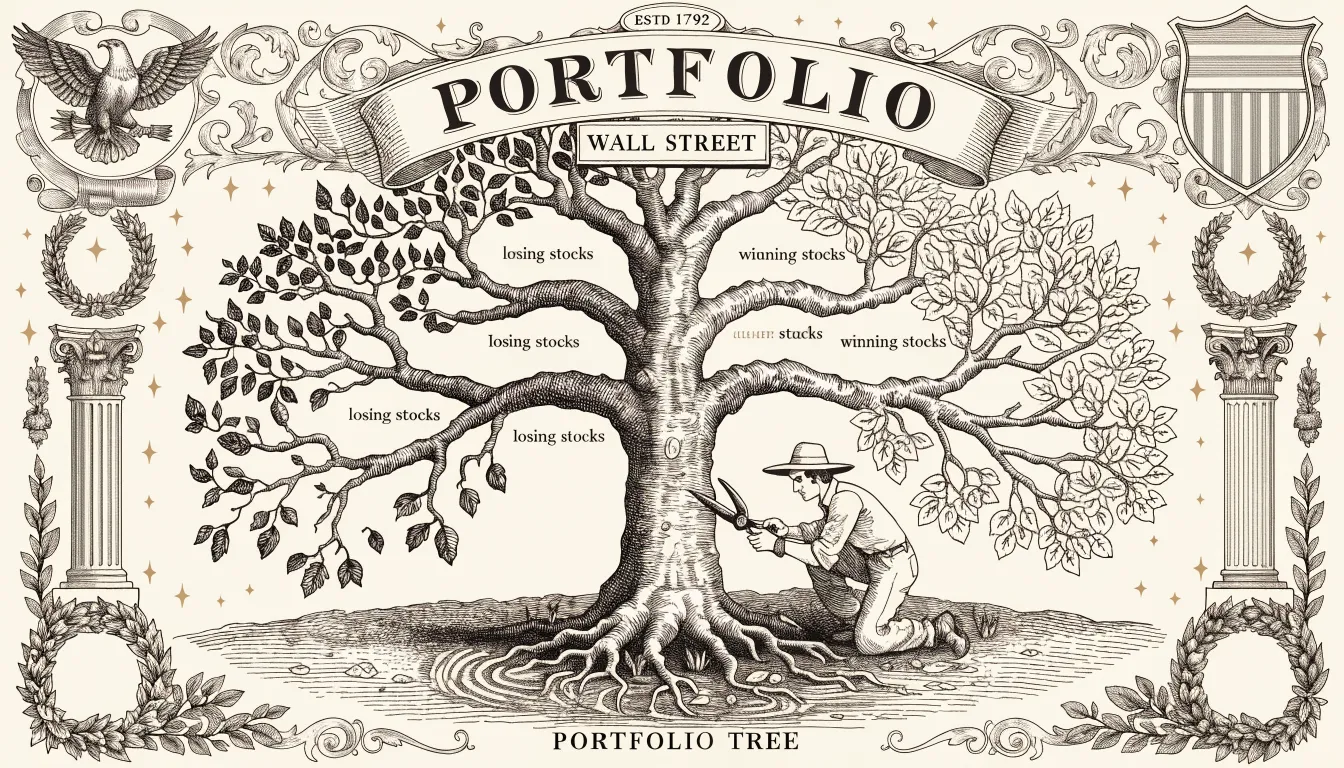
Tax-loss harvesting is the practice of deliberately realising losing positions to offset capital gains in the same tax year, with the proceeds redeployed into similar-but-not-identical exposure. The strategy…
 Taxes & Investing
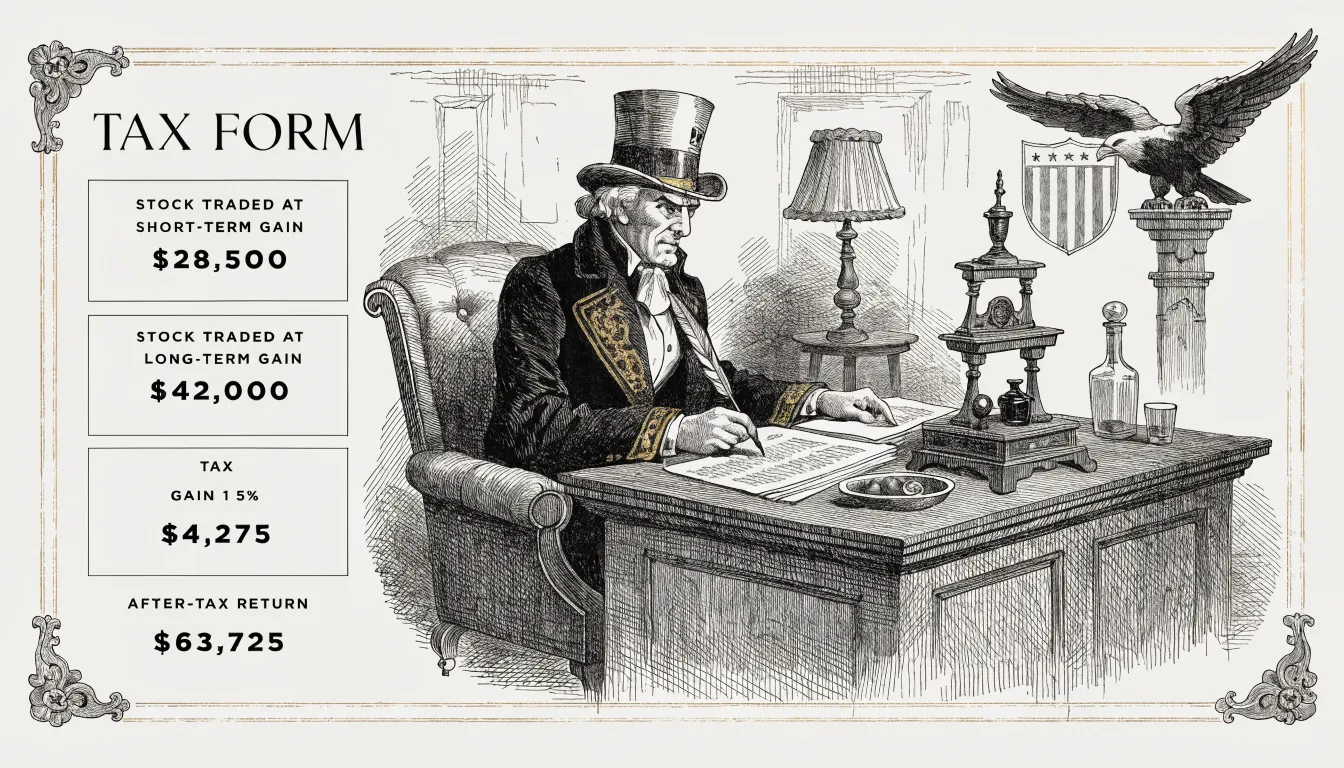
The largest single expense in an active trader’s ledger, after the broker’s commissions, is the federal capital gains tax owed on realised profit. The same fifty thousand dollars…
 Risk Management & Psychology
The risk/reward ratio (R:R) of a trade is the ratio of expected gain to risked loss, defined per trade as (target − entry) / (entry − stop) for…
 Beginner's Path
The number of common stocks listed on US exchanges is in the low thousands; the number an individual analyst can read with any seriousness in a working week…
 Options & Derivatives
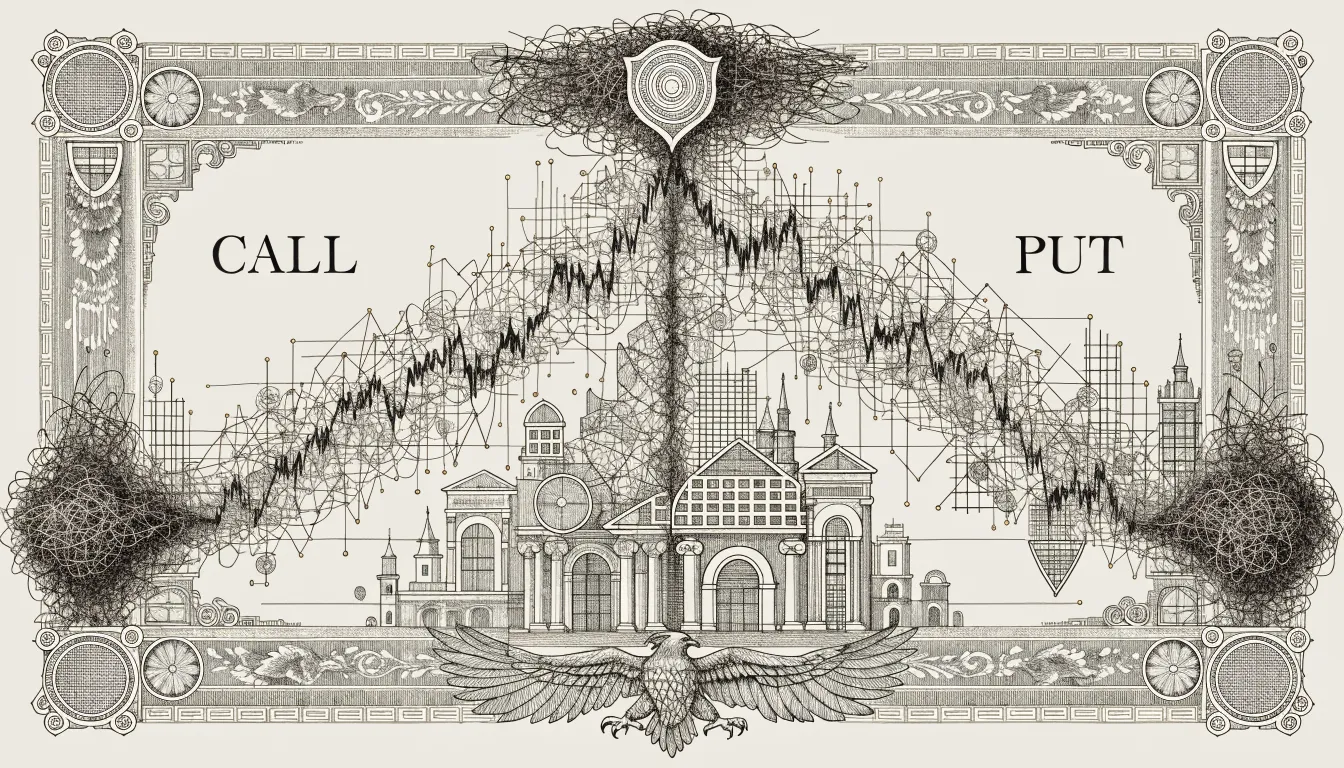
An option is a contract whose payoff is a non-linear function of an underlying asset's price at a future date. The buyer pays a fixed amount today (the…
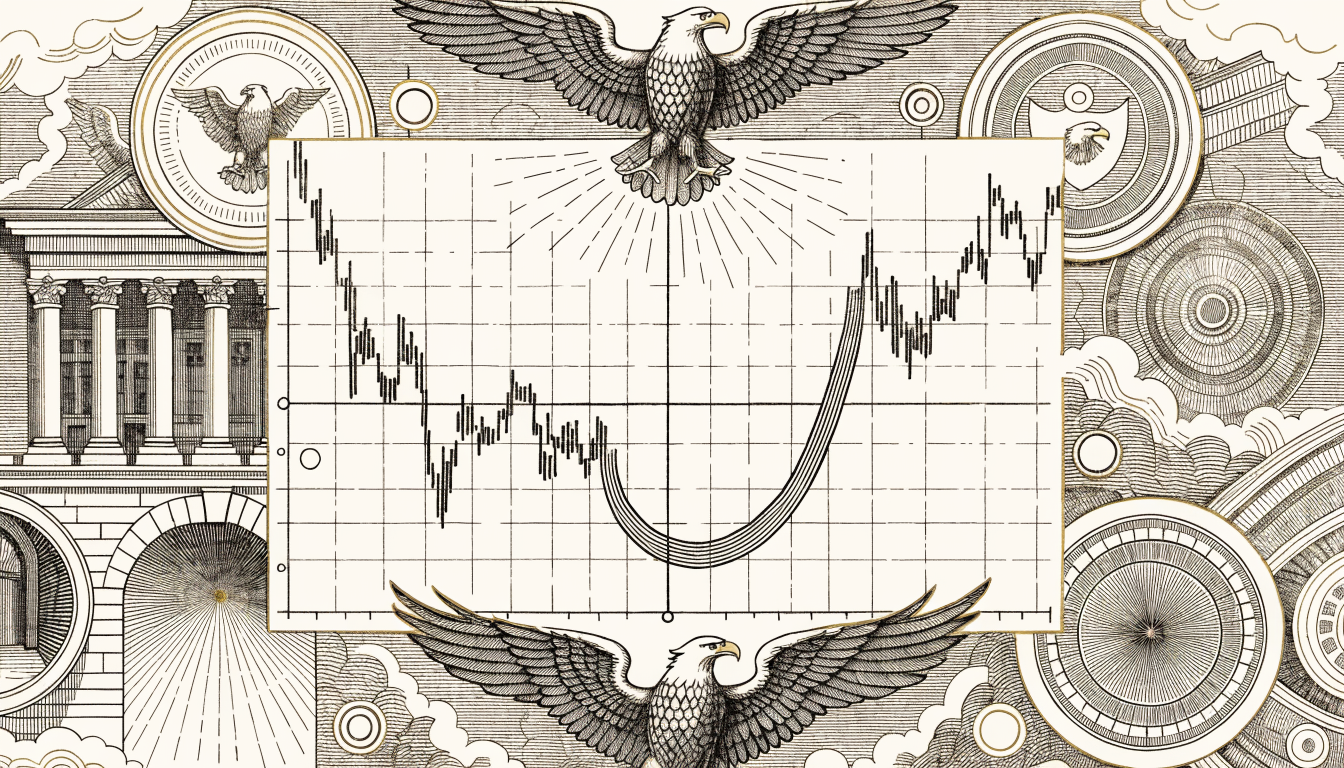 Chart Patterns
The rounding bottom — sometimes called a saucer or U-bottom — is the slowest reversal pattern on the chart, and that’s the whole point. It doesn’t crack. It…
 Options & Derivatives
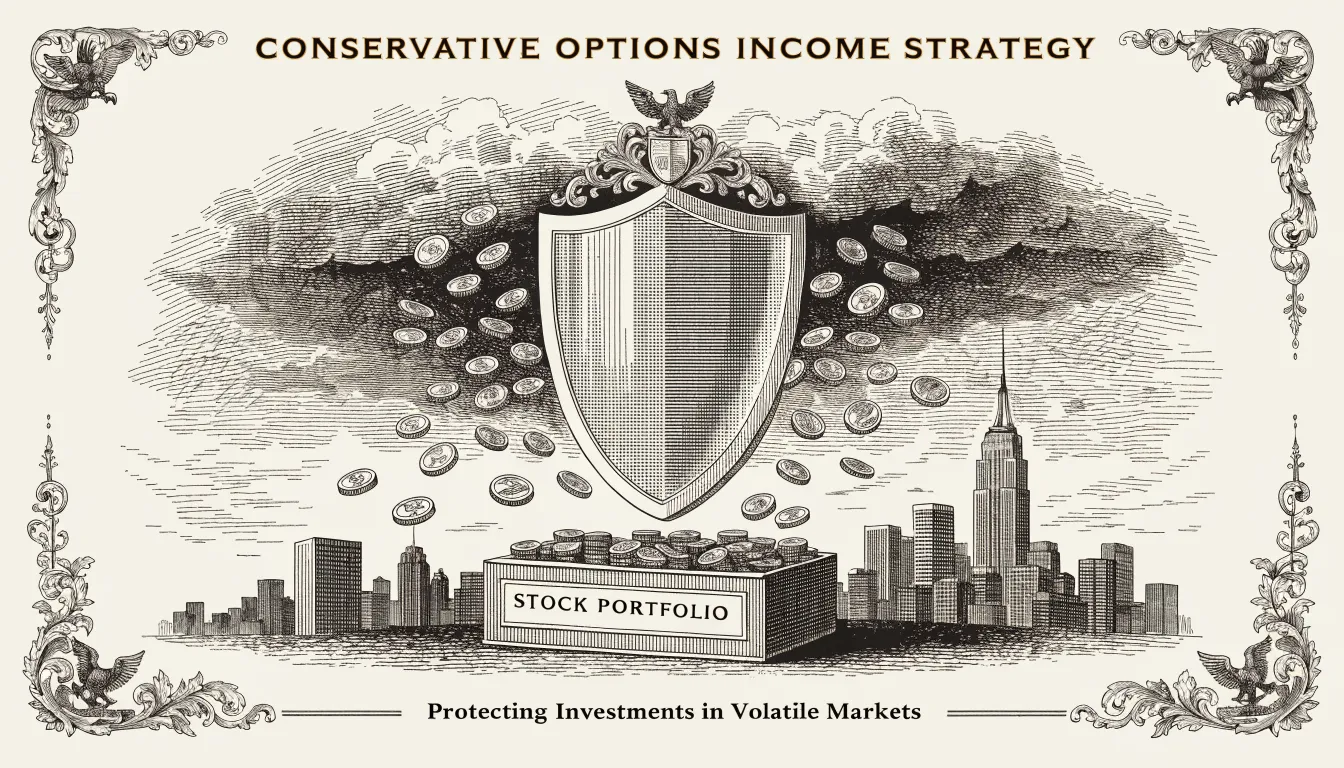
A covered call is a position composed of 100 shares of an underlying long, plus one short call written on those shares. The premium received from the short…
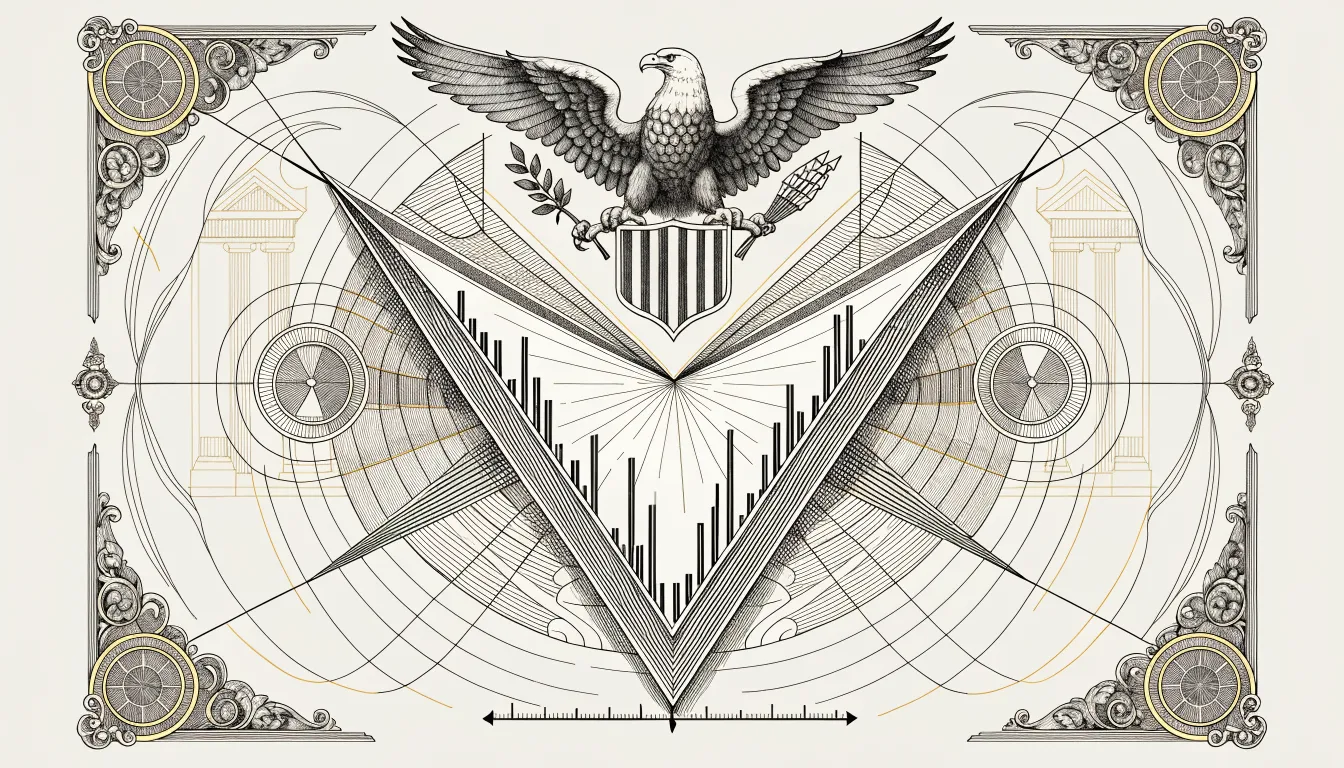 Chart Patterns
A wedge pattern is a chart formation where two trendlines slope in the same direction — both up or both down — while squeezing toward each other as…
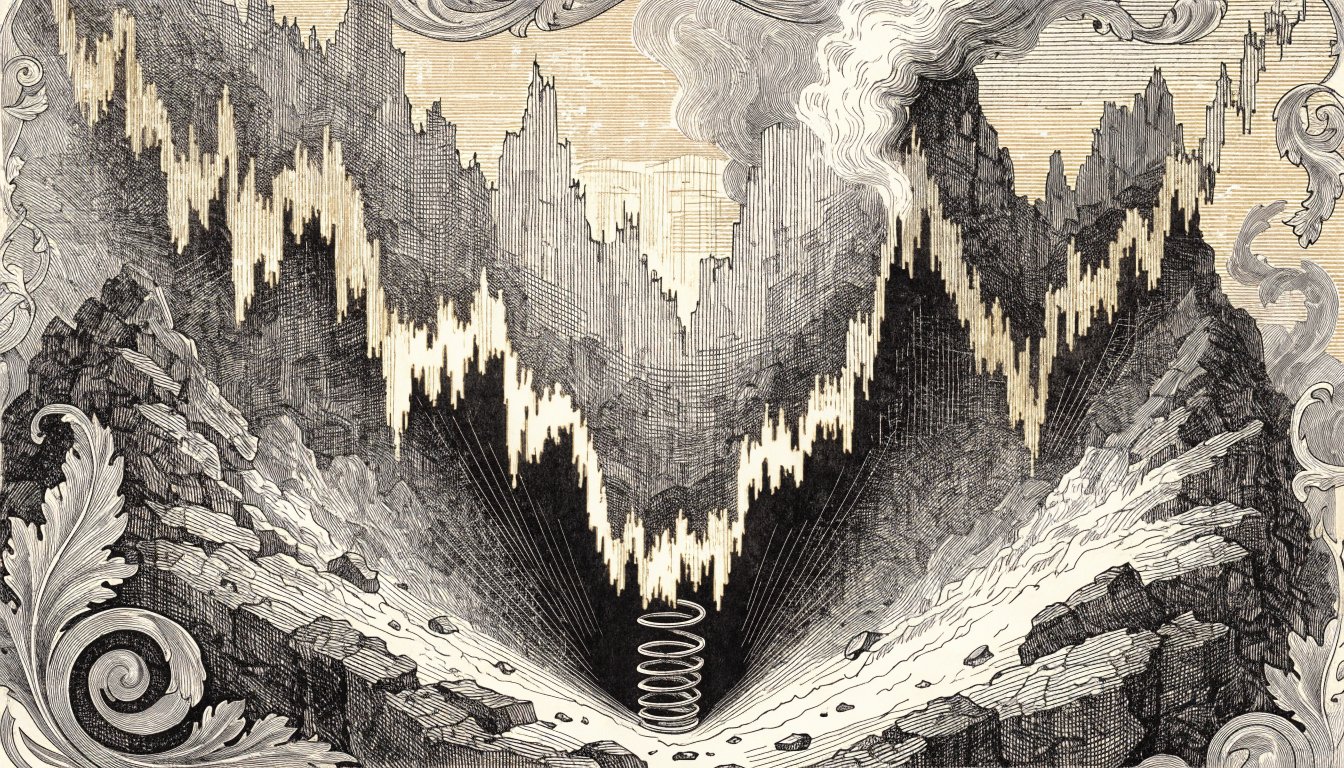 Chart Patterns
The double bottom is a bullish reversal pattern that prints when a downtrend stops working. Price drops into a support level, bounces, comes back to the same zone,…
 Retirement Planning
A young couple sat in my office about ten years ago. He was 29, she was 27, both schoolteachers in the western suburbs. They'd just paid off her…
 Risk Management & Psychology
A client came to see me in March 2009. He was 58, three years from his planned retirement, and he had just sold his entire stock portfolio at…
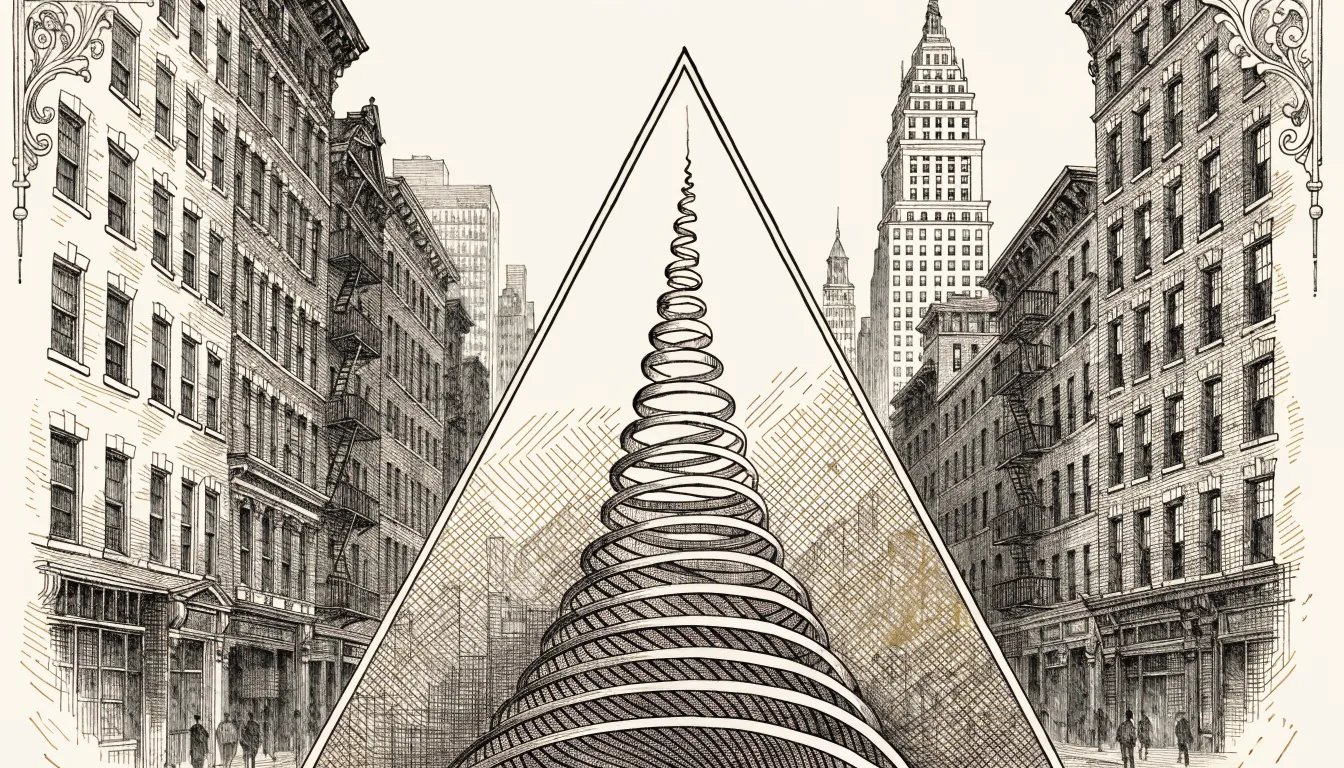 Chart Patterns
Triangles are coiling patterns. Price gets squeezed between two trendlines that converge on each other, volume bleeds out of the tape, and at some point the pressure has…
 Retirement Planning
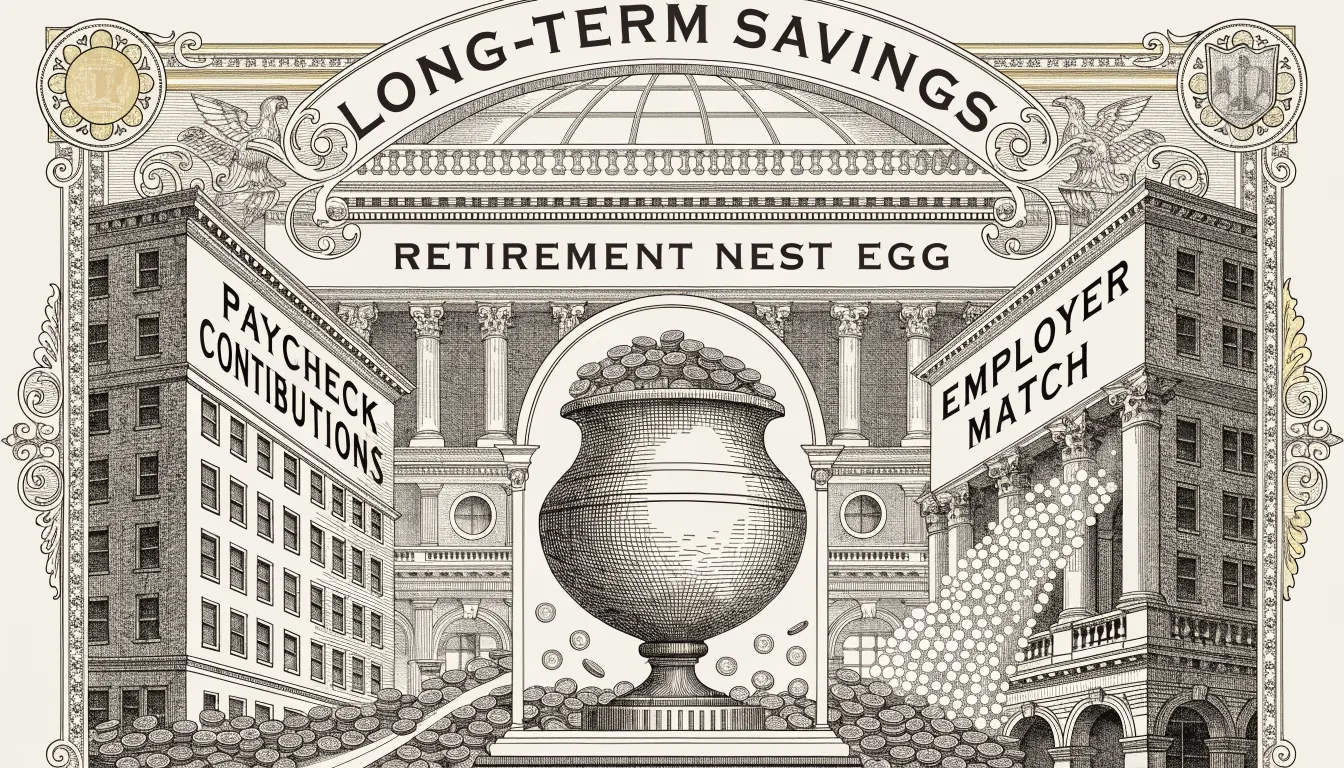
A 401(k) is an account your employer sets up that lets you save for retirement before income tax is taken out of your paycheck. The money grows tax-deferred,…
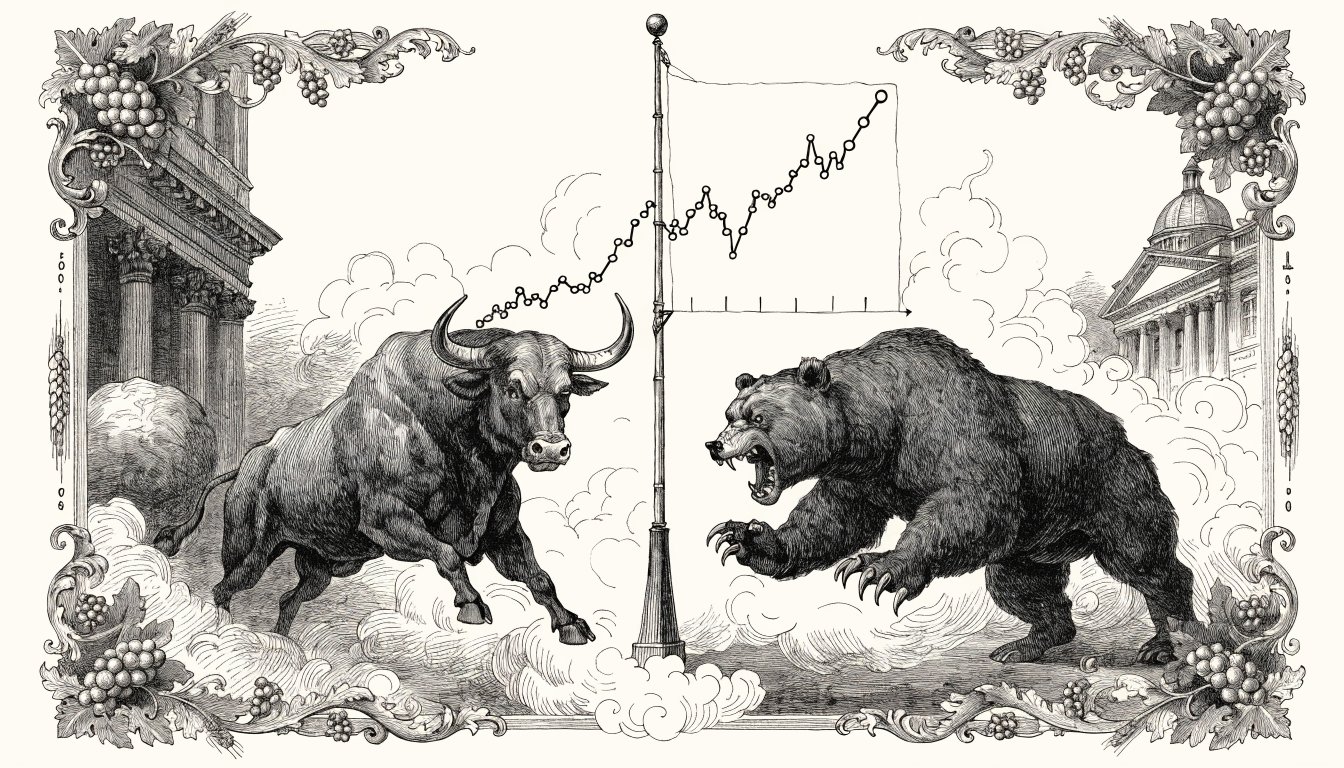 Chart Patterns
NVDA, August 2023. The stock had ripped from 420 to 480 in eight sessions on the back of the Q2 print. Then it stopped. For nine trading days…
 Beginner's Path
A watchlist is the bench between research and execution. It holds the names you've already studied, sized in your head, and decided you'll trade if — and only…
 Beginner's Path
A brokerage account is the account you open with a licensed broker-dealer in order to buy and sell securities. It is the channel between your bank account and…