Ascending triangle — the bullish one
Ascending triangle: a series of higher lows sloping up into a flat horizontal ceiling. Buyers keep stepping in earlier on every dip. Sellers keep defending the same price level over and over. That is the imbalance. Demand is rising, supply at the ceiling is fixed, and fixed supply against rising demand only ends one way most of the time.
Bulkowski put the upside resolution on this pattern at roughly 70%. I do not trade it because of the statistic; I trade it because the order flow tells the same story every time I have watched it. The big seller at resistance has a finite number of shares to feed into bids. Once those shares are gone, the next bid prints through and the stop orders sitting above the line get triggered. That is where the volume surge comes from.
Entry: close above the horizontal resistance on volume at least 50% above the 20-day average. A close, not an intraday poke. Intraday pokes get faded all the time.
Target: measure the widest part of the triangle — from the horizontal ceiling down to the first low of the rising support — and add that distance to the breakout level. Crude but it works.
Stop: just under the most recent higher low inside the triangle. If price closes back inside, you are out. The pattern failed; move on.
Descending triangle — the bearish one
Mirror image. Lower highs sloping down into a flat floor. Sellers are getting more aggressive on every rally; buyers keep defending the same line. Distribution. Bagholders from higher prices are quietly feeding stock into the bid, and every failed bounce shakes another batch of holders into selling.
Resolution to the downside roughly 65% of the time. The breakdown candle usually has a flush quality — the floor cracks, stop-loss orders cascade, and you get a fast move that doesn't bounce for a few sessions. That is the trade.
Entry: short (or exit longs) on a close below the floor on heavy volume. Same volume rule: 50%+ above average minimum, ideally 2x.
Target: measure the height at the widest point and subtract from the breakdown level.
Stop: back inside the triangle, above the most recent lower high.
Symmetrical triangle — the neutral one
Both lines converging: lower highs AND higher lows. Price is being squeezed from both sides at once, and the pattern itself does not tell you which way it will resolve. Statistics say it breaks in the direction of the prior trend about 55% of the time. That makes it a soft continuation pattern. Fifty-five percent is barely better than a coin flip. Do not pre-position.
The trade is simple: wait for the break, then act. Buy the upside close, short the downside close, both with volume. Front-running the direction inside a symmetrical is gambling on a guess. The market charges you anyway.
One sourced statistic worth keeping in front of you on the close cousin pattern, the rising wedge: failure rate around 24% when traded inside the structure, dropping to about 6% if you simply wait for the confirmed downside breakout. Average decline after the break, roughly 19%. Most likely decline closer to 15%. Those are Bulkowski's numbers and they encode the whole argument for patience in a single comparison.
Volume is the whole game
If you take nothing else from this article, take this: a triangle without the right volume profile is not a triangle. It is just price chop with two lines drawn on top of it.
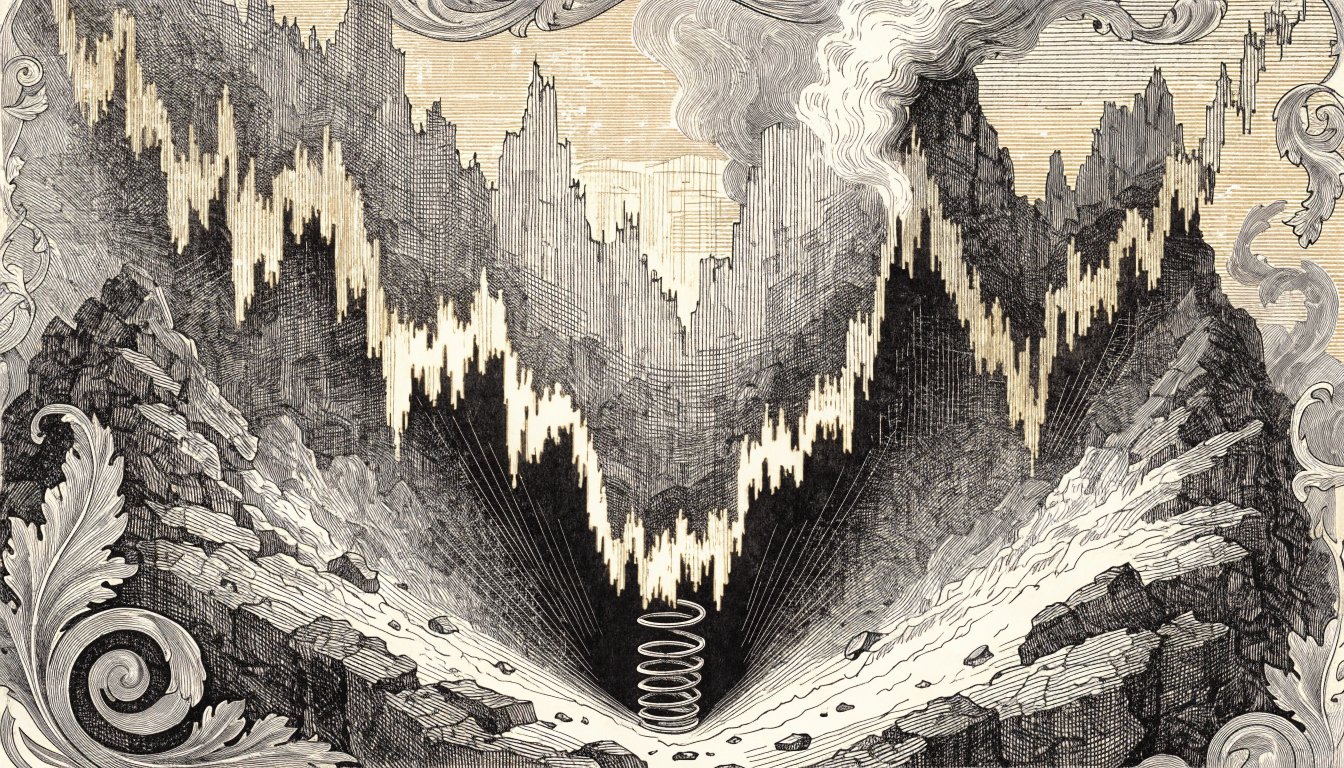
What you want to see during the formation: volume declining as the range tightens. Both sides are losing conviction, the tape goes quiet, the candles shrink. That is compression. That is the coiled spring. When the breakout comes, volume should surge — ideally 2x the 20-day average or better. Weak-volume breakouts get faded back into the range a depressing amount of the time.
One more rule that matters: where in the triangle does the breakout happen? Breakouts in the first two-thirds of the structure are stronger than breakouts that happen jammed up against the apex. By the time the lines have nearly touched, both sides have run out of fight and the move has less fuel behind it. Reading a triangle late in its life is like sitting on a fishing boat watching the surface go flat right at the end of a tide change — the bite that was going to happen has happened, and you are working dead water. The cleanest breaks come when there is still some room left in the pattern.
Trade example: AMD, summer 2023
AMD spent most of June and the first half of July 2023 grinding sideways between roughly 110 and 132. Higher lows on every pullback — 110, 113, 116, 118 — while sellers kept hitting the same 132 ceiling four separate times. Textbook ascending triangle. Volume was bleeding out across the formation. Nobody on the timeline was talking about it because the whole tape was obsessed with NVDA.
July 19th, AMD closes at 132.84 on volume that is 80% above the 30-day average. That is the trigger. I bought 200 shares at 133.10 the next morning, stop at 127.50 just below the last higher low. Risk on the position about $1,120. Measured target was 132 + (132 - 110) = 154.
The trade worked. AMD ran soft to 128 the following session on a broad market wobble — uncomfortable, the stop did not get hit but I was watching it — then climbed to 142 by early August. I trimmed half at 142, moved the stop to break-even, and the runner got me out at 148 a week later when the trend cracked. Final R-multiple a touch over 2. Not a moonshot. Exactly what the pattern is supposed to deliver: defined risk, asymmetric payoff, clean exit.
Where most people get this wrong
Trading inside the triangle. The triangle is a consolidation zone, not a trade. Until price breaks one of the lines on volume, there is no edge in there. Buying off the rising support inside a triangle is a guess about the next leg. Sometimes it works. The expected value is negative.
Anticipating a symmetrical. Already covered. Coin flip. Wait.
Ignoring context. A triangle that forms after a clean uptrend is a different animal from a triangle that forms in directionless chop. Trends create triangles that resolve in the direction of the trend most of the time. Chop creates triangles that resolve into more chop. Look at the daily chart before you trade the hourly setup.
Skipping the volume check. I see guys at the desk take a triangle breakout because the candle looked good, without ever pulling up the volume bar. Half of those breakouts are false. The volume bar is not optional — it is the whole confirmation.
Wedges — close cousin, different bias
Wedges look like triangles but both lines slope the same way. A rising wedge has both trendlines tilting up, and despite the upward slope it is a bearish setup. Price is making higher highs and higher lows but the range is narrowing, which means momentum is dying inside an apparent uptrend. A falling wedge is the opposite: both lines slope down, but the narrowing range inside the decline means selling pressure is exhausting itself, and the resolution is usually upward.
The wedge statistic above is the part to internalize. The failure rate drops by a factor of four if you just wait for the confirmed breakout instead of shorting inside the pattern. Stop trying to be early. Let the pattern complete, confirm with volume, then put the trade on.
Why these patterns fit the way active traders work
Triangles show up all the time in liquid momentum names. The reason this pattern fits the way an active book gets traded is the structural symmetry between the entry, the stop, and the target: buy the upside break, stop under the last higher low, target the measured move. Risk is small and quantifiable. Reward is multiples of the risk when it works. When it does not, you are out for a defined and minor loss and on to the next setup. That asymmetric payoff structure — modest defined risk, sizable potential reward — is the reason risk management frameworks were built around chart patterns in the first place. The pattern gives you the setup. The breakout gives you the trigger. Your sizing keeps you alive long enough for the math to work in your favor.
See also: Cup and Handle Pattern · Head and Shoulders Pattern · Support and Resistance · Understanding Volume