 Technical Analysis
RSI Divergence: Hidden Trend Signals
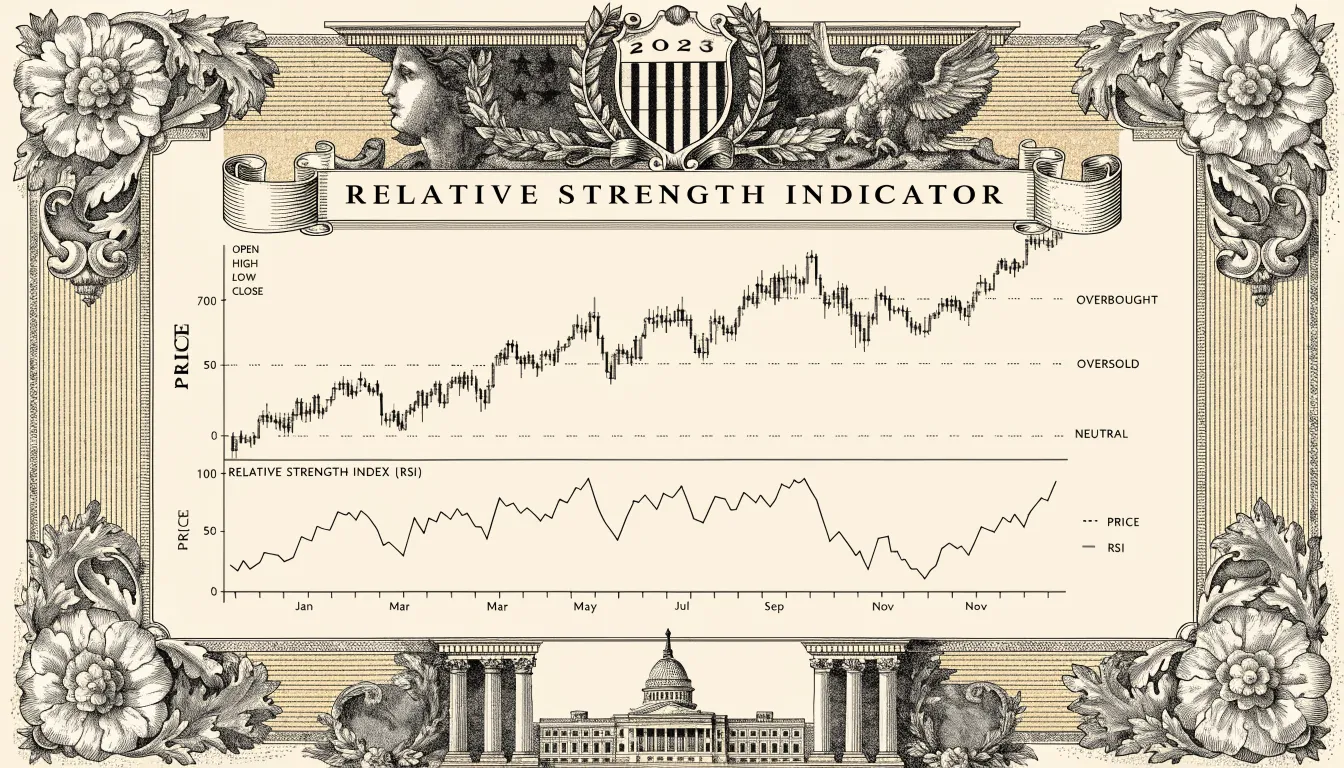
RSI divergence shows up when the Relative Strength Index and price stop agreeing with each other. Stock prints a new high, RSI prints a…
10 articles tagged “chart patterns”.
Technical Analysis
RSI divergence shows up when the Relative Strength Index and price stop agreeing with each other. Stock prints a new high, RSI prints a…
 Technical Analysis
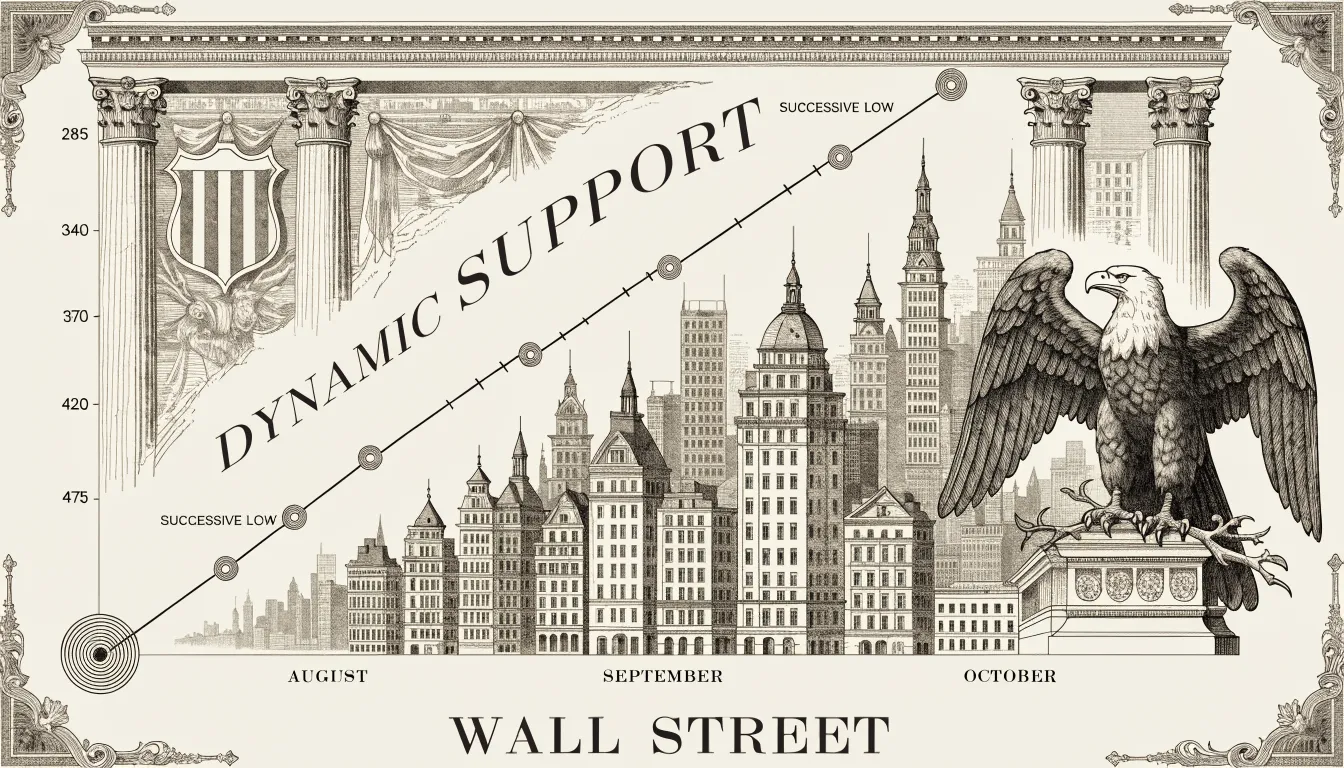
A trend line is the simplest tool on the chart and one of the few I still draw by hand on every name I…
 Chart Patterns
The rounding bottom — sometimes called a saucer or U-bottom — is the slowest reversal pattern on the chart, and that’s the whole point.…
 Chart Patterns
A wedge pattern is a chart formation where two trendlines slope in the same direction — both up or both down — while squeezing…
 Technical Analysis
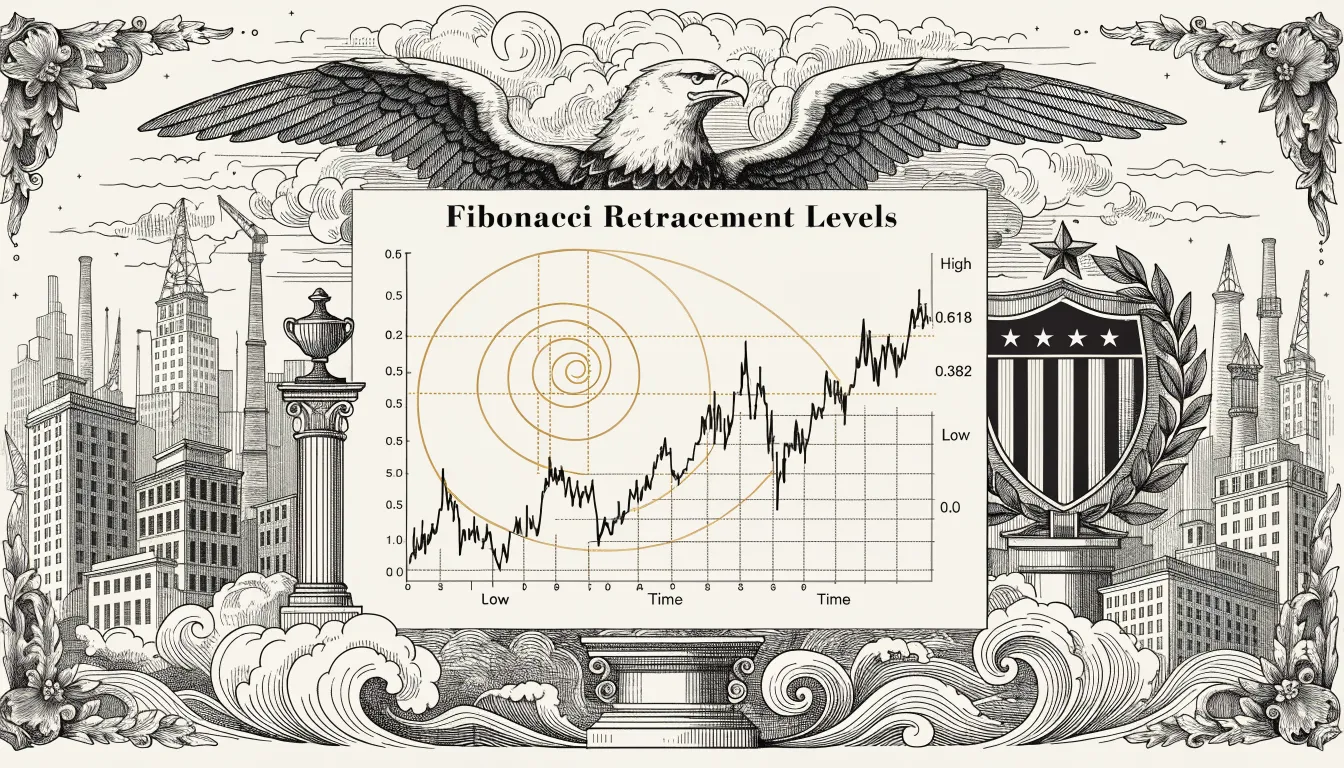
Fibonacci retracements come wrapped in more mysticism than any other tool on the chart, and most of it is garbage. The math is real.…
 Chart Patterns
Triangles are coiling patterns. Price gets squeezed between two trendlines that converge on each other, volume bleeds out of the tape, and at some…
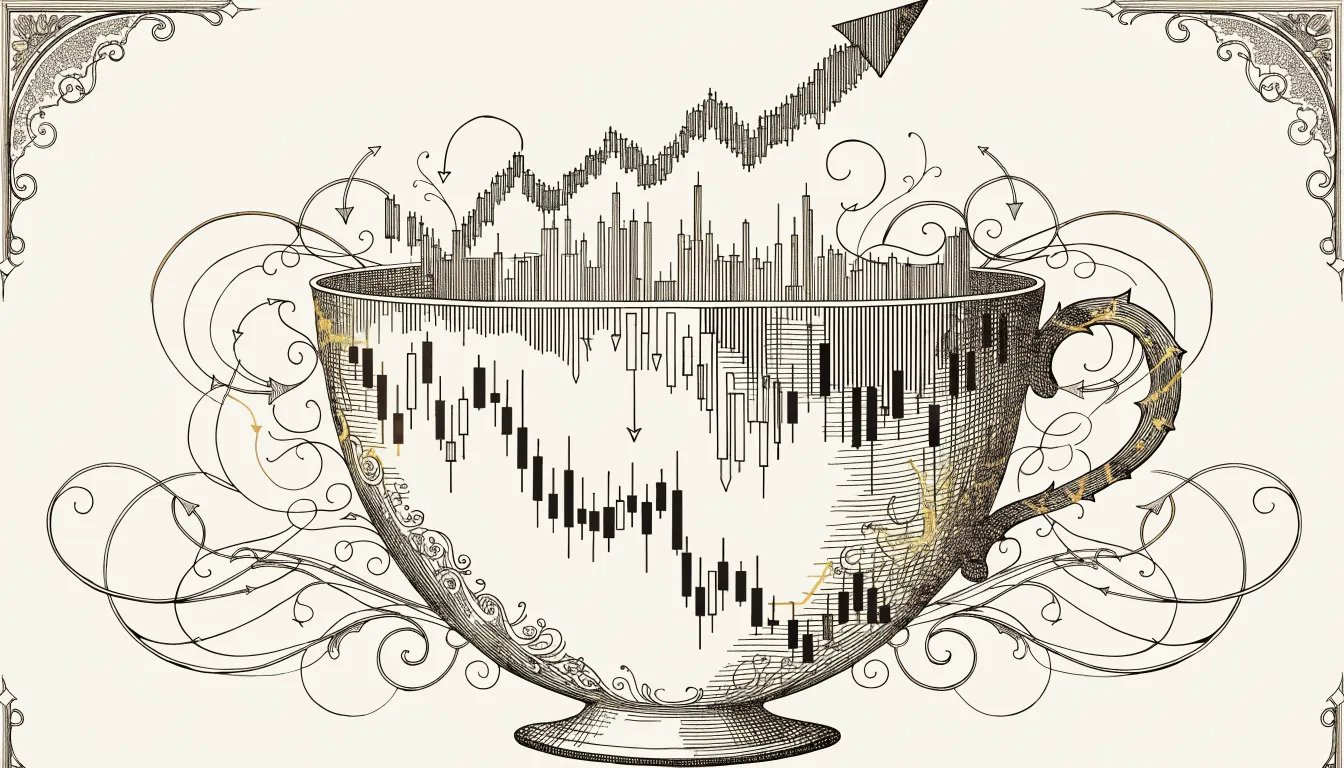 Chart Patterns
NFLX, spring 2021. Fourteen-week cup off the post-earnings flush, handle forming clean in the upper third, volume drying up the way it's supposed to.…
 Chart Patterns
The double bottom is a bullish reversal pattern that prints when a downtrend stops working. Price drops into a support level, bounces, comes back…
 Stock Trading Encyclopedia
Technical analysis is the study of price action and trading volume to forecast where a stock heads next. Fundamental analysis reads the company —…
 Chart Patterns
META, fall of 2022. The stock had been bleeding all year and then put in a three-peak rally between September and late October that…