 Stock Trading Encyclopedia
Pre-Market and After-Hours Trading
The US stock market's regular session runs from 9:30 AM to 4:00 PM Eastern Time, Monday through Friday. Trading does not stop when the closing bell rings. Pre-market…
Stock Trading Encyclopedia
The US stock market's regular session runs from 9:30 AM to 4:00 PM Eastern Time, Monday through Friday. Trading does not stop when the closing bell rings. Pre-market…
 Technical Analysis
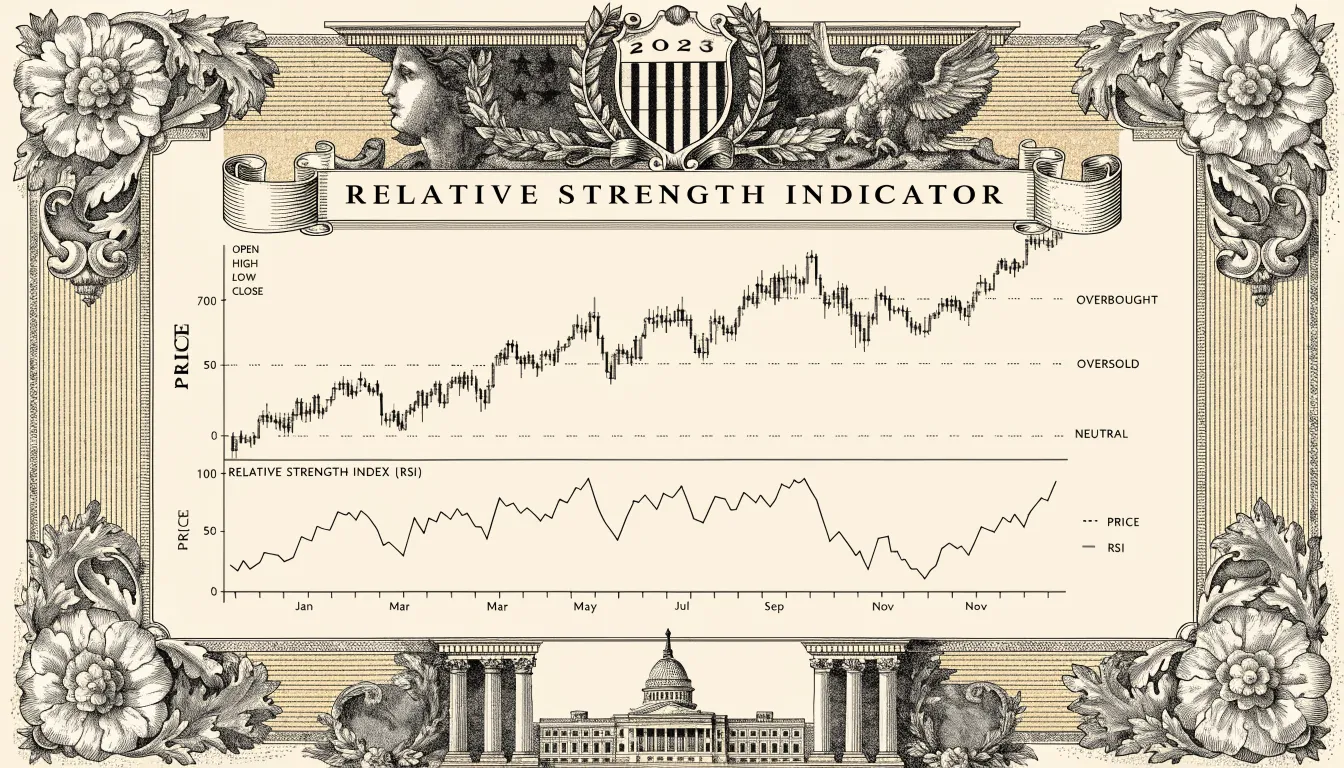
RSI divergence shows up when the Relative Strength Index and price stop agreeing with each other. Stock prints a new high, RSI prints a lower one. Stock prints…
 Stock Trading Encyclopedia
The Securities and Exchange Commission (SEC) defines a penny stock as any equity security trading below $5 per share that is not listed on a national securities exchange…
 Technical Analysis
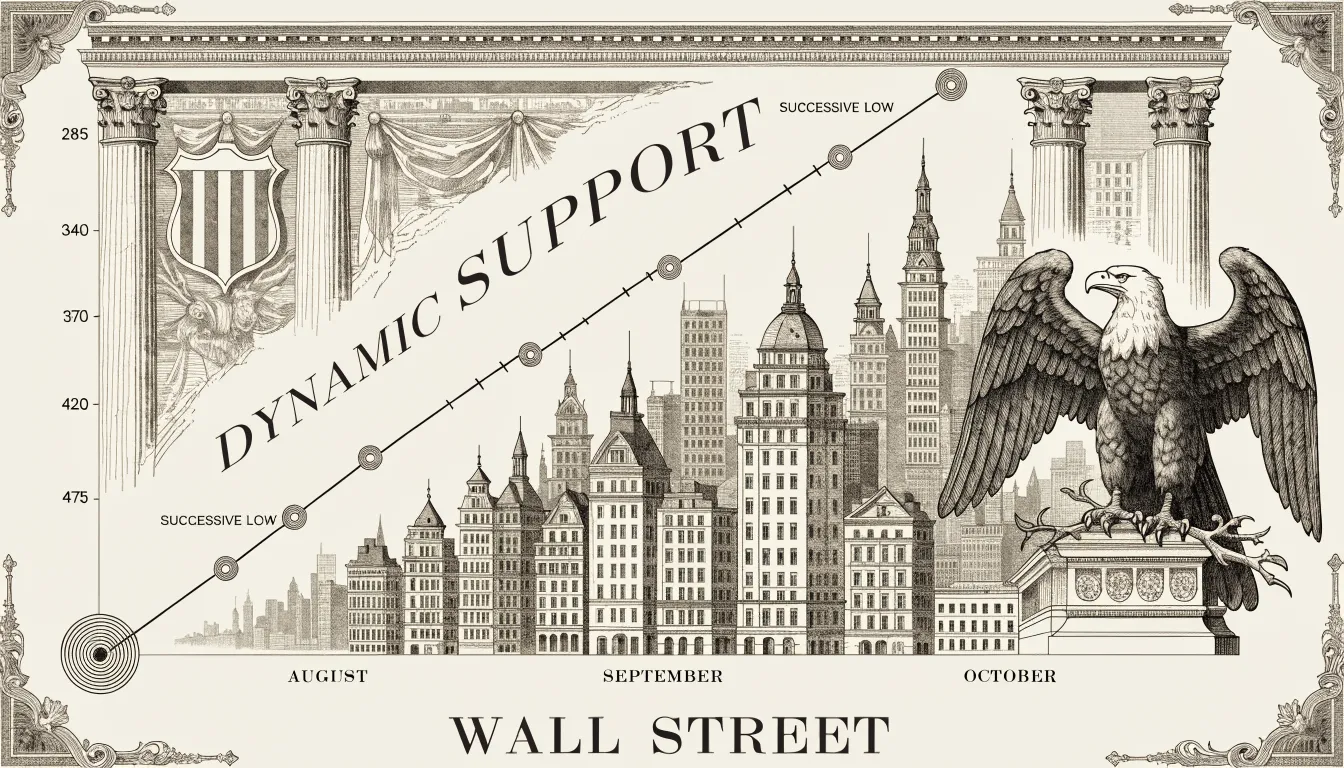
A trend line is the simplest tool on the chart and one of the few I still draw by hand on every name I trade. It is a…
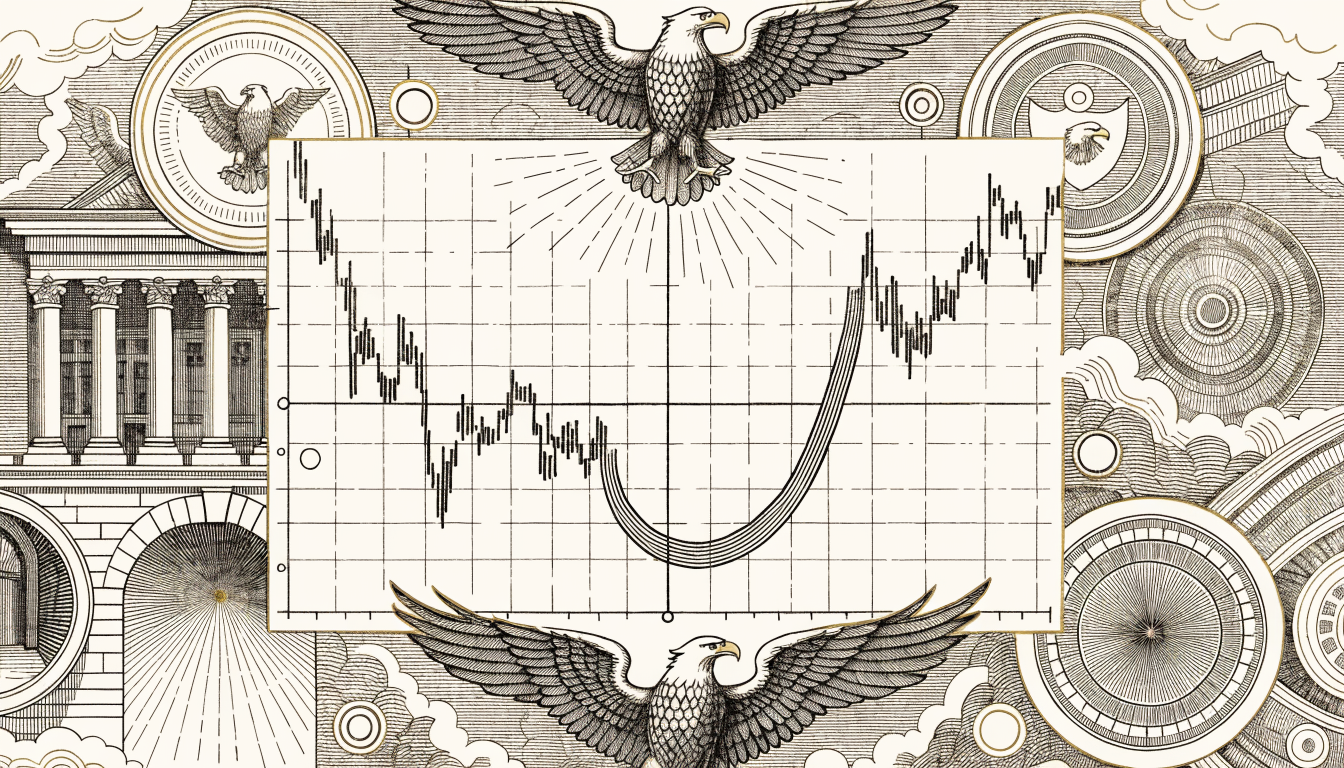 Chart Patterns
The rounding bottom — sometimes called a saucer or U-bottom — is the slowest reversal pattern on the chart, and that’s the whole point. It doesn’t crack. It…
 Chart Patterns
A wedge pattern is a chart formation where two trendlines slope in the same direction — both up or both down — while squeezing toward each other as…
 Technical Analysis
The Ichimoku Kinko Hyo — "one glance equilibrium chart" — is a technical analysis system built by Japanese journalist Goichi Hosoda in the late 1930s and published in…
 Trading Strategies
Scalping is the trade where you fight for nickels and dimes per share, hold for seconds to a few minutes, and put on twenty to fifty positions a…
 Trading Strategies
A breakout happens when price punches through a resistance level or breaks down through a support level that has held the stock for weeks. The supply/demand balance flips.…
 Beginner's Path
A watchlist is the bench between research and execution. It holds the names you've already studied, sized in your head, and decided you'll trade if — and only…
 Stock Trading Encyclopedia
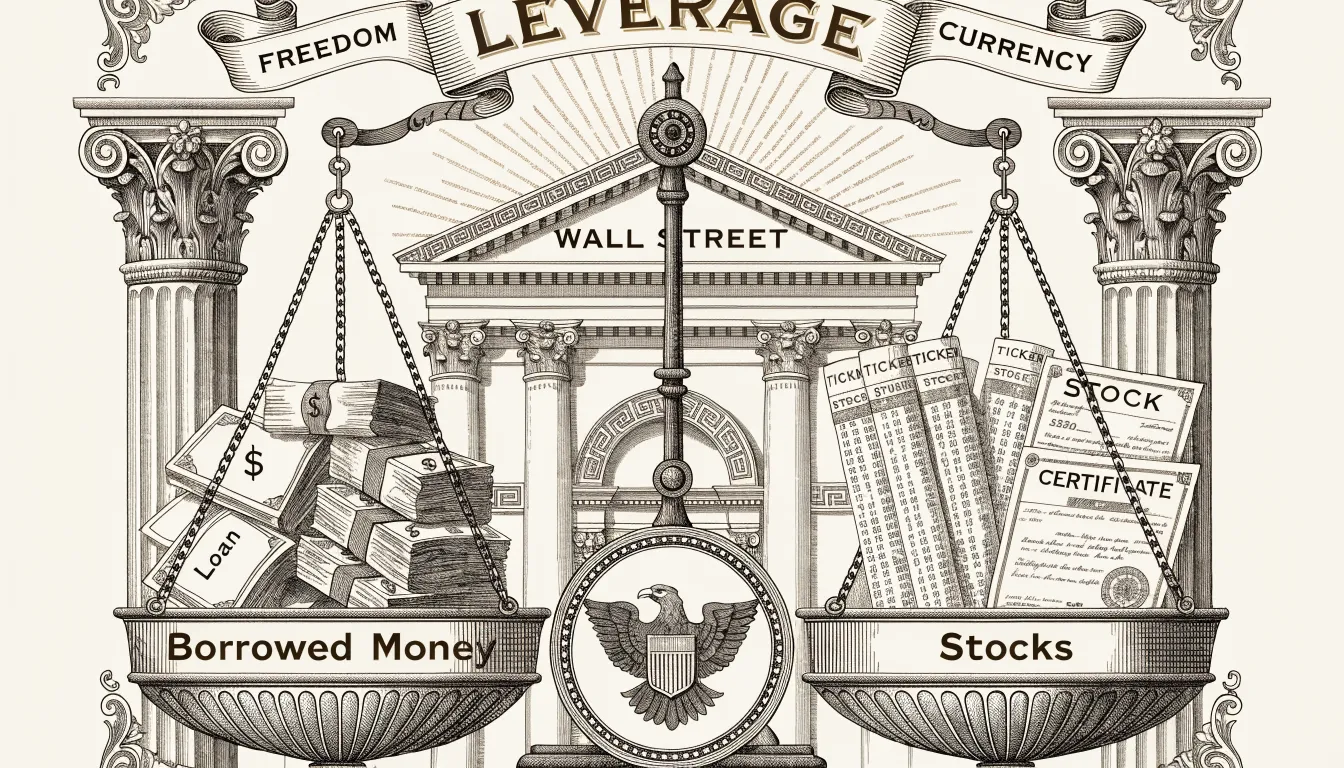
Margin trading means borrowing money from your broker to buy stocks, with your existing portfolio posted as collateral. Instead of paying the full price in cash, you put…
 Technical Analysis
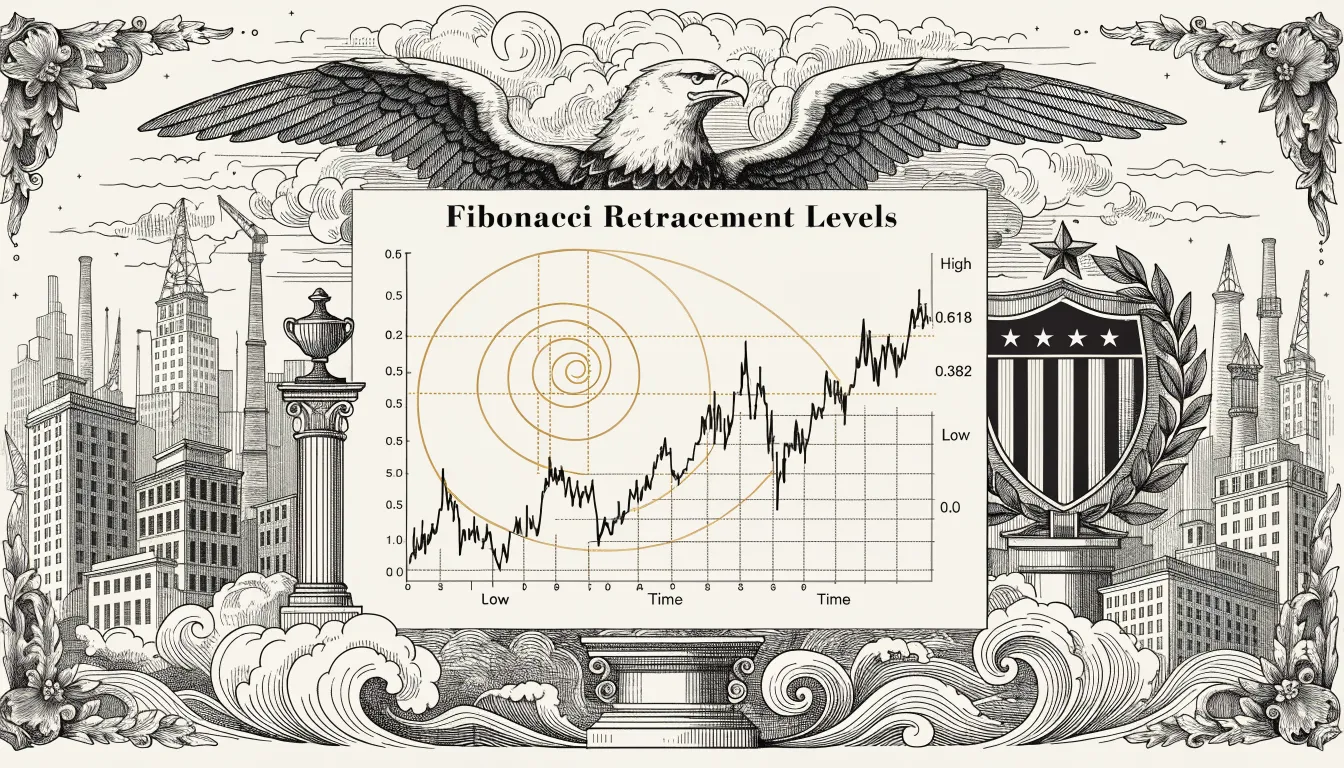
Fibonacci retracements come wrapped in more mysticism than any other tool on the chart, and most of it is garbage. The math is real. Leonardo of Pisa wrote…
 Technical Analysis
A candle is one period’s argument between buyers and sellers, drawn on the chart. Daily, hourly, five-minute — pick the timeframe and the candle tells you what happened…
 Stock Trading Encyclopedia
Short selling is selling shares you don't own, with the plan to buy them back later at a lower price. You borrow stock from your broker, sell it…
 Trading Strategies
Momentum trading is the simplest sentence on a trading desk and one of the hardest jobs on a screen: buy what is going up, sell what is going…
 Trading Strategies
Eighty percent of day traders lose money in their first year. That number has been replicated in academic studies for twenty years and it has not moved. About…
 Trading Strategies
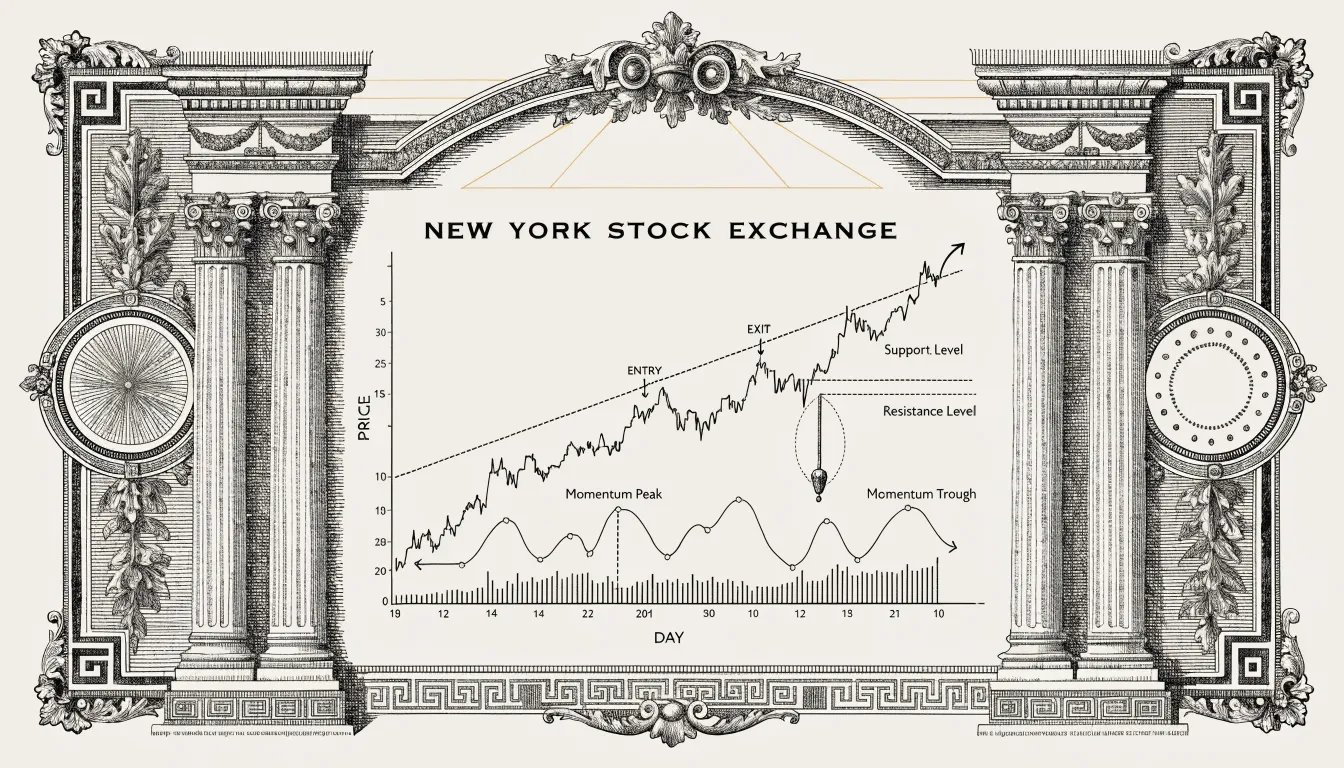
Swing trading is what most people on a screen actually do, even when they call it something else. Holding period: two days to a few weeks. Not a…
 Chart Patterns
NVDA, August 2023. The stock had ripped from 420 to 480 in eight sessions on the back of the Q2 print. Then it stopped. For nine trading days…
 Chart Patterns
Triangles are coiling patterns. Price gets squeezed between two trendlines that converge on each other, volume bleeds out of the tape, and at some point the pressure has…
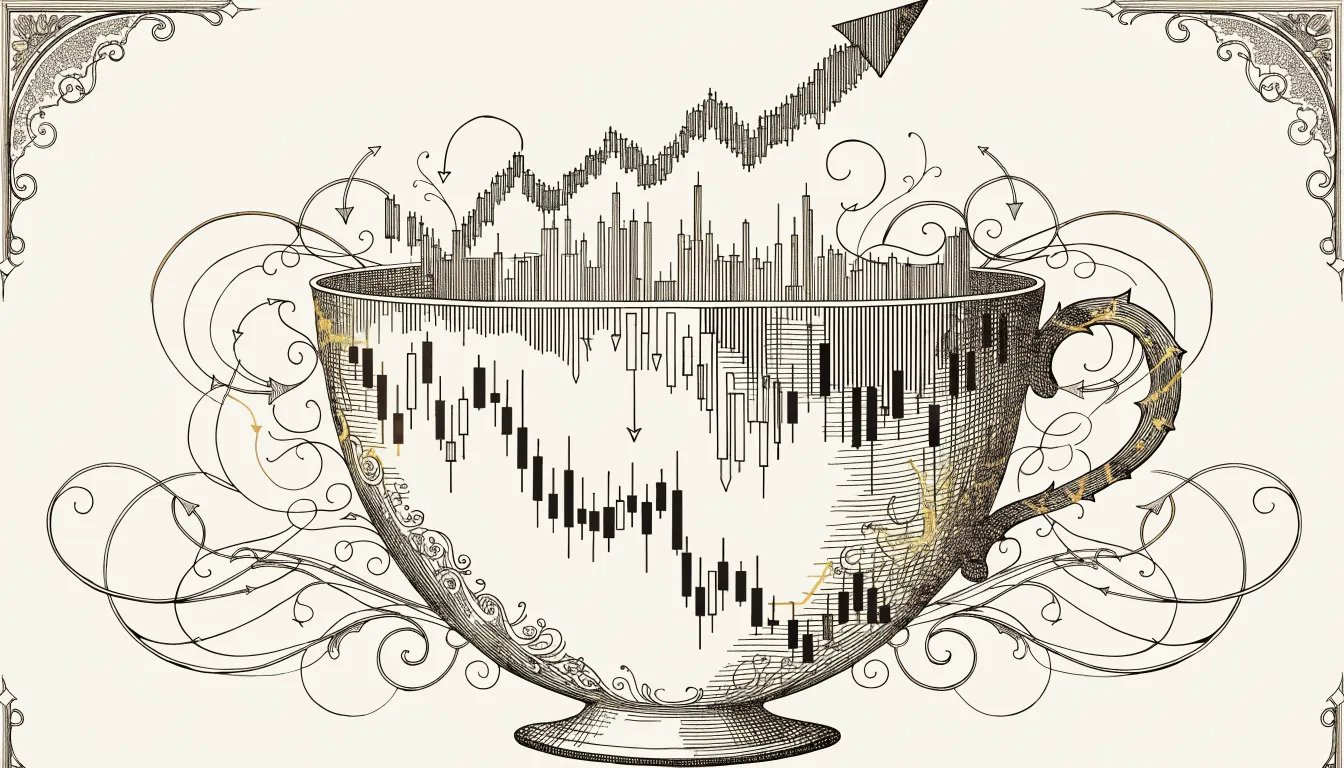 Chart Patterns
NFLX, spring 2021. Fourteen-week cup off the post-earnings flush, handle forming clean in the upper third, volume drying up the way it's supposed to. Textbook. I'd marked the…
 Chart Patterns
The double bottom is a bullish reversal pattern that prints when a downtrend stops working. Price drops into a support level, bounces, comes back to the same zone,…
 Technical Analysis
The MACD — Moving Average Convergence Divergence — is a momentum indicator Gerald Appel built in the late 1970s that maps the relationship between two moving averages of…
 Technical Analysis
The Relative Strength Index (RSI) is a momentum oscillator J. Welles Wilder Jr. built in 1978 to measure the speed and magnitude of recent price moves on a…
 Technical Analysis
Support and resistance are the oldest ideas in technical analysis and still the two I lean on hardest after eighteen years on a screen. Support is the price…
 Technical Analysis
AAPL, late May 2023. The stock had been riding above its 20-day EMA for six straight weeks, pulling back to tag the line twice and bouncing both times.…
 Stock Trading Encyclopedia
Position sizing is the least exciting topic in this guide, and the most important. Nobody tells the story of a loss they cut at six percent. Nobody buys…
 Stock Trading Encyclopedia
Volume is the total number of shares traded in a given period. Most beginners look only at price and miss the second half of the signal. Price tells…
 Stock Trading Encyclopedia
Technical analysis is the study of price action and trading volume to forecast where a stock heads next. Fundamental analysis reads the company — earnings, balance sheet, business…
 Chart Patterns
META, fall of 2022. The stock had been bleeding all year and then put in a three-peak rally between September and late October that lined up almost too…
 Stock Trading Encyclopedia
Penny stocks are equities trading at very low prices — the SEC draws the line at $5 per share, but most traders use the label for names under…