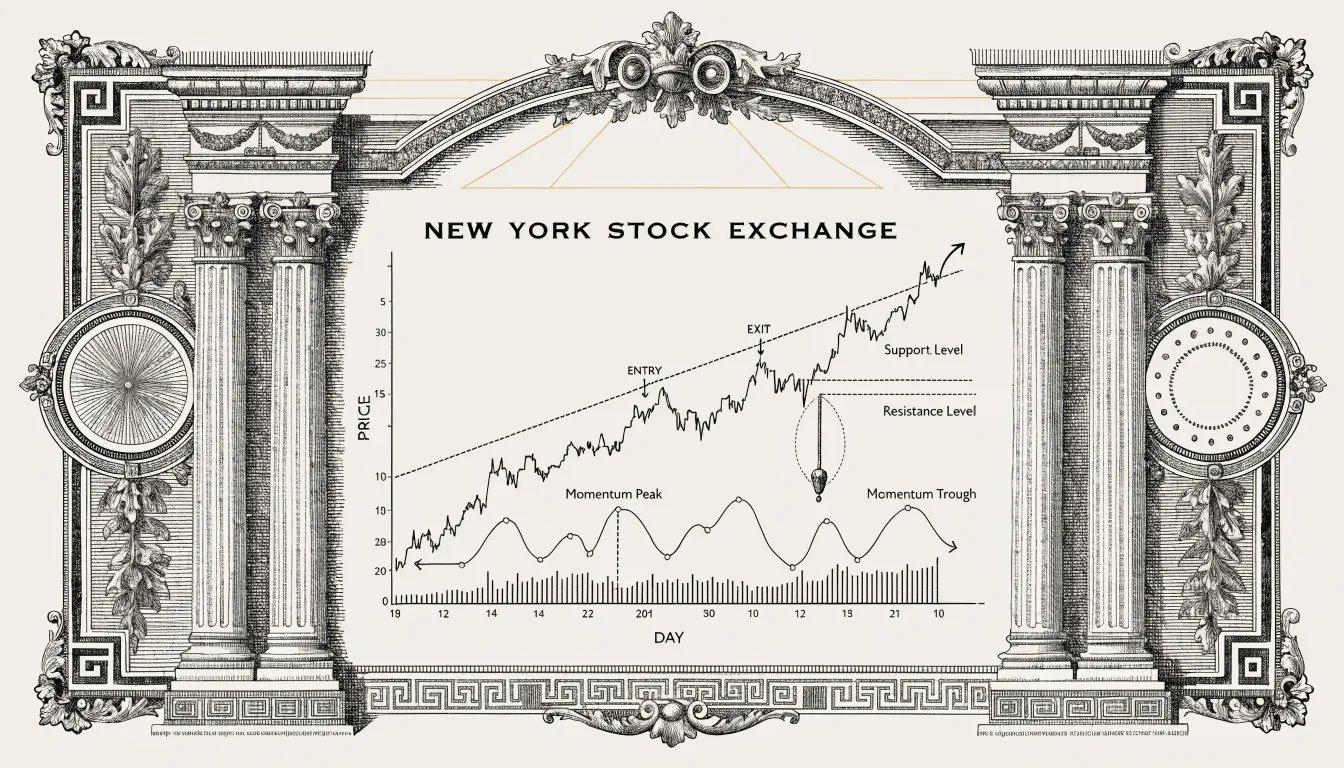
Why The Trend Keeps Going
People want to dress momentum up as something mysterious. It is not. The reason a stock keeps moving after the catalyst is that most of the buyers have not shown up yet. The hedge funds get the news in their morning meeting on Monday. The mutual funds get it through their analyst pipeline by Wednesday. The retail crowd reads the headline the following weekend. Each group is another wave of demand into the tape. That is the whole engine.
Three behavioural forces stack on top of each other and they are worth knowing mechanically, not philosophically.
Underreaction. Earnings beat, contract win, sector tailwind — whatever fired the move, the first day rarely prices it in. The stock rises but it lags the news. Over the next thirty to sixty sessions more buyers digest the data and the price grinds higher. That is post-earnings drift, and it is real and tradable.
Herding. Humans are pack animals. When a chart is green and other traders are bragging on Twitter, fear of missing out drags fresh buyers in. New buyers push price higher. Higher price attracts more buyers. The loop runs longer than any fundamental analyst will defend in a meeting.
Confirmation bias. Once a stock is rising, the analysts upgrade, the media gets friendlier, the bull side gets the microphone. Narrative and price reinforce each other. That is essentially George Soros’s reflexivity dressed in different clothes. You do not have to believe any of this as theory. You have to recognise it on the tape and trade it.
The Four-Item Checklist Before A Stock Earns Watchlist Space
I do not run a thirty-line scanner. I run four checks, and a name has to clear all four before it sees screen time on my desk.
Relative strength. The stock is outperforming SPY over three, six, and twelve months. If the index is up 5% and your name is up 40%, the stock is doing something the market is not. Top decile of relative performance is where momentum lives. Below that you are hunting in the wrong forest.
New highs. Stocks at 52-week or all-time highs tend to keep going. That sounds backwards to most people. It is not. There is no overhead supply — nobody is sitting on a losing position waiting to break even and dump on you. Every holder is in the green. Sellers are a thin crowd.
Volume surge. Average daily volume going from one million to three million on a green day is the tell. Something changed. When the volume comes with rising price, that is institutions buying. When the volume comes with falling price, walk.
Stacked moving averages. Price above the 10, 20, 50, and 200-day moving averages, and the averages stacked in that order from top to bottom. Every timeframe in agreement. We call it stacking on the desk and it is one of the cleanest momentum reads on the chart.
Stacked. Green. Loud. If a name does not show all three on the daily chart, it is not a momentum stock yet, no matter what the story sounds like.
Three Ways To Trade It
Breakout Momentum
The classic. You buy when price breaks above a defined resistance level — a chart pattern, a previous high, the top of a consolidation range — and the breakout prints on volume two to three times the 30-day average. The volume is not optional. A breakout on dying volume is a fade waiting to happen. A breakout on real volume is a genuine shift in supply and demand. This is the engine behind every cup and handle, every triangle, every flag I trade in my own book.
Pullback Momentum
Better risk-to-reward, harder discipline. Stock rips, then pulls back to a moving average or a support level on declining volume, then resumes. You buy the pullback. Your stop sits just under the pullback low so the dollar risk is tight. The catch is patience. The pullback will not always come, and watching the runner go without you is part of the cost. Run it correctly and this is essentially the swing trading entry I take most weeks.
Earnings Momentum
Companies that beat estimates tend to keep beating estimates. The post-earnings drift is one of the most documented anomalies in finance. The play: stock gaps up on heavy volume after the print, you buy the day-one or day-two pullback, you ride the drift for thirty to sixty sessions. AAPL did exactly this off the late-May 2023 base — the breakout off 181 came on the back of a clean beat and the stock did not really rest until July.
What This Looks Like On A Real Ticker
AAPL, late May into early June 2023. The stock had based for six weeks between 173 and 181. Tight coil. Volume drying up. Earnings beat lit the fuse. First green candle out of the base printed 183 on volume already 40% of the 30-day average by 10:00 a.m. That was the signal. New highs, relative strength leading the index, volume confirming, MAs stacked. Every box on the checklist checked.
I bought 400 shares at 182.80 on the morning of the breakout, stop under 180.50, dollar risk about $930 on the position. Not a size to brag about. Enough that if I was wrong I would feel it. Trimmed half into 186.50 on the second up-day, moved the stop to break-even on the rest. The runner ran into the 190s by mid-July before a news-day wick took me out around 193. Total on the trade was roughly 2.4R. One unit of risk gave me 2.4 units of profit. That is the setup. That is the whole playbook.
You do not have to nail the exact print. You buy the breakout, you put your stop under the base low, you size so the dollar risk is something you can lose without the rest of your week falling apart. The reader who chased the third green day at 188 had a worse trade. That is a different problem — the entry, not the read.
Same DNA on the small-cap side. A thin-float name breaks above a multi-week base on volume ten times its average and runs from a buck-and-change into the threes in four sessions. A different ticker the same week breaks $0.26 and accelerates to $0.69 in three weeks. Different price ranges. Different sizes on the position. Same chart.
When Momentum Stops Working
Momentum is not a free lunch. The strategy gets murdered in three environments and you need to know them on sight.
Market reversals. When the broad tape rolls over hard — 2008, March 2020, the late-2021 ARKK unwind — momentum names get hit the worst. The stocks that rose the most fall the fastest. The leaders become the source of liquidity for the panic. I watched it happen in 2008 from a desk four floors above Broad Street and I watched it again on the screens during COVID. Same movie, different cast.
Choppy markets. When the index goes sideways and nothing trends, every breakout fails by Wednesday. The strategy needs trend to function. In chop you either step aside or you size down to a fraction of normal. There is no third option that ends well.
Crowded trades. Too many momentum traders piled into the same name means the exit door is jammed when the move ends. The selling cascades. This is particularly brutal in thinly-traded penny stocks where liquidity disappears the second the bid steps away.
The antidote is risk management you actually follow, not the kind you write in your journal and ignore. Every momentum trade has a predetermined stop. When momentum fades — declining volume, RSI divergence, a clean break of the 20-day MA — you exit. You do not wait for a reason. Momentum does not need a reason to end. It ends when the buyers stop showing up.
The Honest Note On Sizing
Here is the part I will say once. The reason most traders lose money on momentum stocks is not that they pick the wrong charts. They pick decent charts. Sometimes they pick excellent charts. They lose because they put on size that ignores the volatility of the name they are trading.
A momentum stock can move 8-12% in a single session. If your stop is 6% away and you are risking 3% of the account on the position, one bad print blows out a third of your year. The math is boring and the math is the whole game: account times 0.01 equals max risk per trade, divided by the distance from entry to stop equals max share size. Run it on every ticket or accept that the market will eventually run it for you, with worse outcomes.
I lost $29,000 on a single name in April 2022 because I chased an opening print on a gap-up instead of waiting for a handle. The setup was not wrong. The size and the entry were wrong. The chart said wait. I did not wait. That is the lesson recycled.
Momentum And Value Are Different Tools, Not Opposites
Plenty of writers set momentum and value investing up as enemies. Cheap stocks waiting to be discovered versus expensive stocks getting more expensive. They are not enemies — they measure different things. Value tells you what a company is worth. Momentum tells you whether the market is starting to agree. A stock cheap on the fundamentals AND showing positive momentum on the chart is the cleanest setup in the book. The market mispriced the company and is in the process of correcting that mispricing. The fundamentals tell you why it should run. The technicals tell you when to get on.
I do not run a fundamentals book myself. That is a different game and there are operators who do it better than I ever will. But when both signals line up on the same ticker, you do not ignore it. You take the trade and you let the size be smaller because two engines are firing at once and you can afford to carry it longer.
What The Tape Is Actually Telling You
Listen to the tape, don’t argue with it. When a stock rips on volume, the market is telling you something positive is happening that you do not yet fully know. When it dumps on volume, the market is telling you something negative. Your job is to read that and act, not to argue with the price about what it “should” be doing on a discounted-cash-flow model. The price is doing what it is doing. Trade that.
Reading the tape is not different in kind from reading the water before you drop a line offshore. You watch the colour change, the bait scattering, the birds working a patch — you do not know which fish is under there but you know enough is happening that the next move is to put a line in. A green chart on rising volume is the same kind of read. You do not need to know which institution is buying or why. You need to recognise that they are.
Practical Rules To Take Away
Momentum trading rewards patience for the right setup and ruthlessness on the exit. Most beginners get those backwards. They are impatient on the entry and indecisive on the exit. Flip it. Wait for the chart to do what you need it to do before you put on size. Then trust your stop the way you trusted the setup.
Three things to commit to muscle memory:
One, never enter without a stop already defined. The stop is not optional and it is not a suggestion. The day you start moving a stop lower is the day you find out what your account really looks like.
Two, size based on the distance to the stop, not on how confident you feel. Confidence is not a position-sizing input. The math is.
Three, when the read fades — volume drying up, RSI rolling, the 20-day breaking — you exit. You do not negotiate. You do not give it “one more day.” You take the partial gain or the small loss and you move on. There is another setup along in a week.
Momentum is not mindless trend-chasing. It is reading the tape as information and respecting the stop you wrote down before the trade went on. Do that for three years and you will still be in the chair. Most will not.
See also: Swing Trading · Technical Analysis · Understanding Volume · Support and Resistance