 Chart Patterns
Cup and Handle Pattern
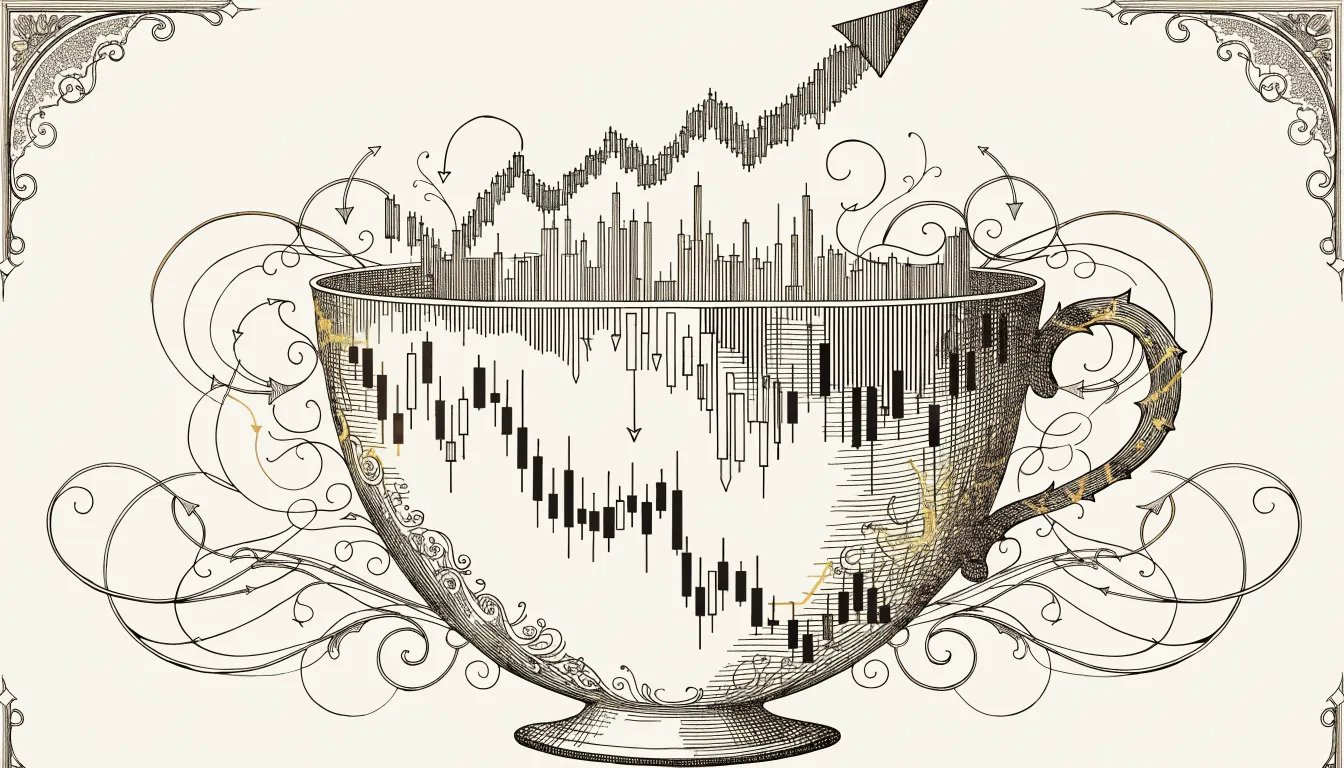
NFLX, spring 2021. Fourteen-week cup off the post-earnings flush, handle forming clean in the upper third, volume drying up the way it's supposed to. Textbook. I'd marked the…
Visual patterns that signal trading opportunities
Chart Patterns
NFLX, spring 2021. Fourteen-week cup off the post-earnings flush, handle forming clean in the upper third, volume drying up the way it's supposed to. Textbook. I'd marked the…
 Chart Patterns
META, fall of 2022. The stock had been bleeding all year and then put in a three-peak rally between September and late October that lined up almost too…
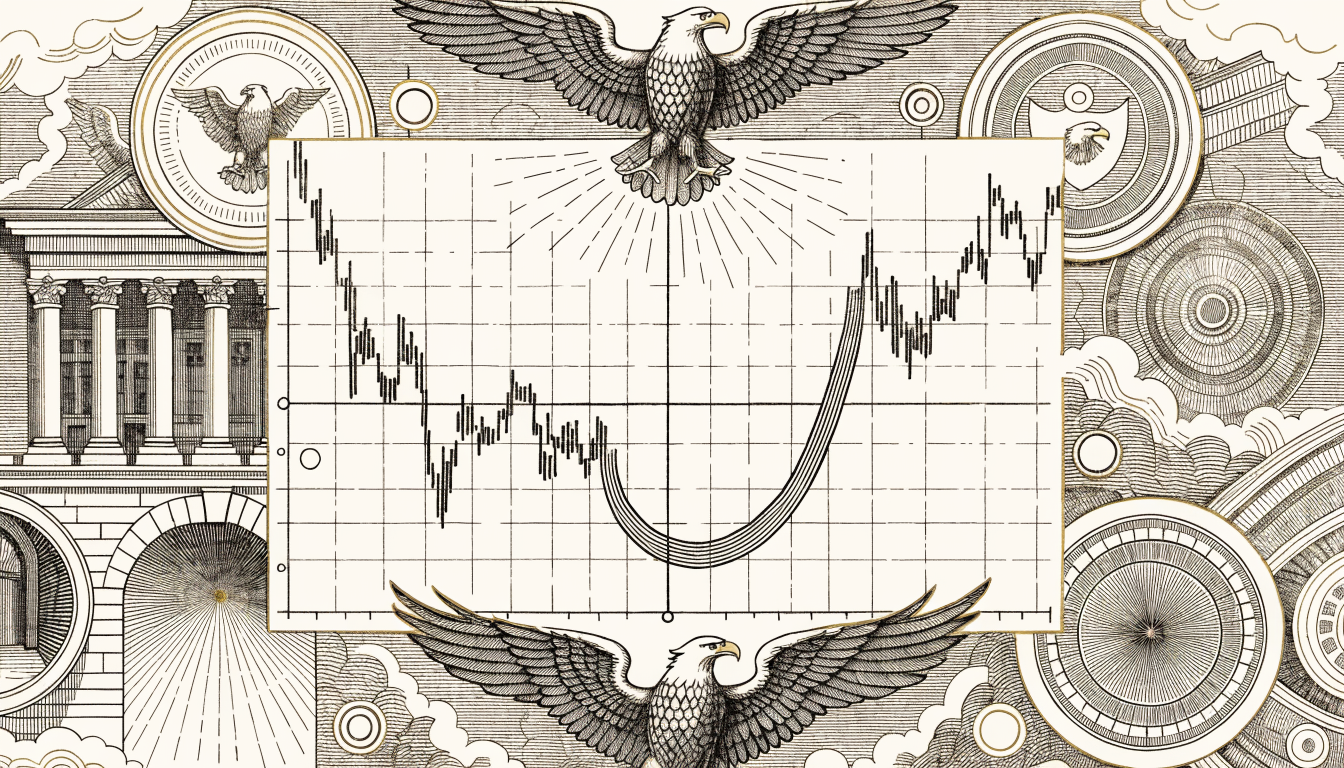 Chart Patterns
The rounding bottom — sometimes called a saucer or U-bottom — is the slowest reversal pattern on the chart, and that’s the whole point. It doesn’t crack. It…
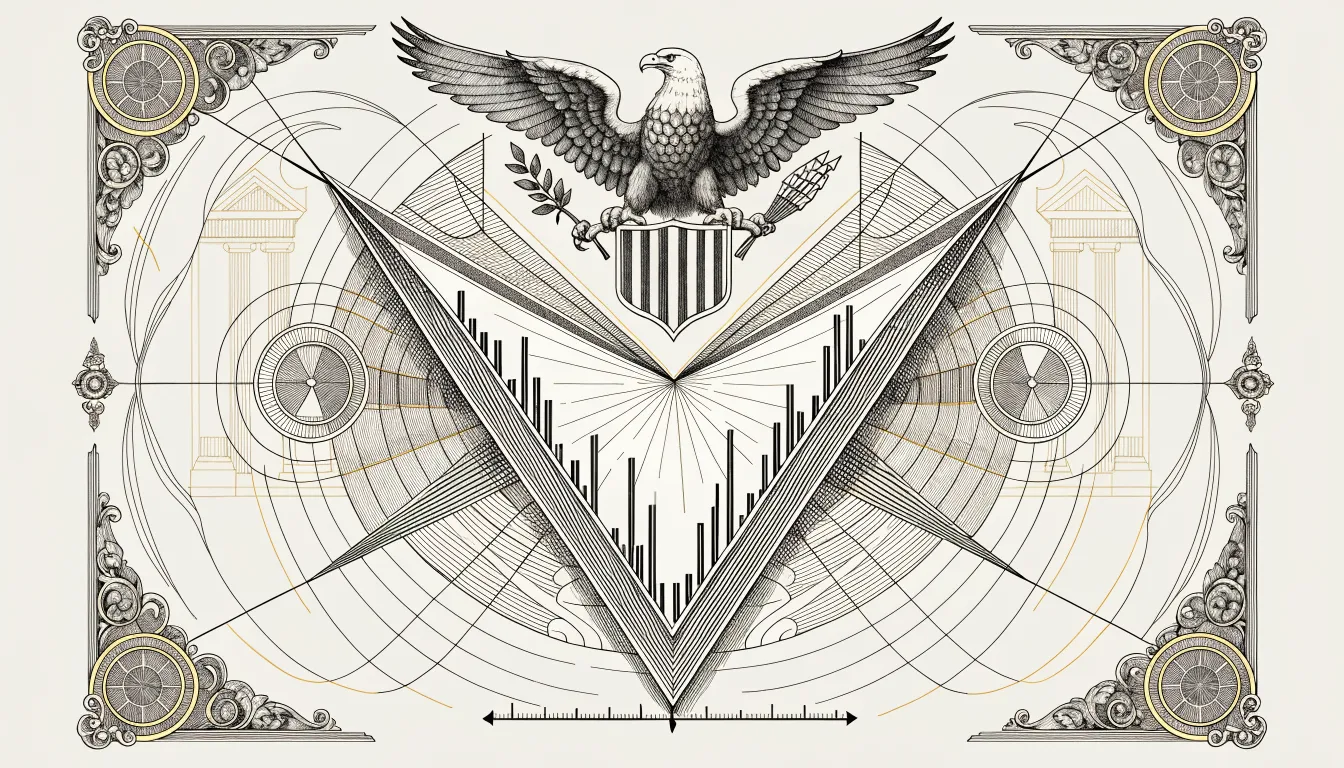 Chart Patterns
A wedge pattern is a chart formation where two trendlines slope in the same direction — both up or both down — while squeezing toward each other as…
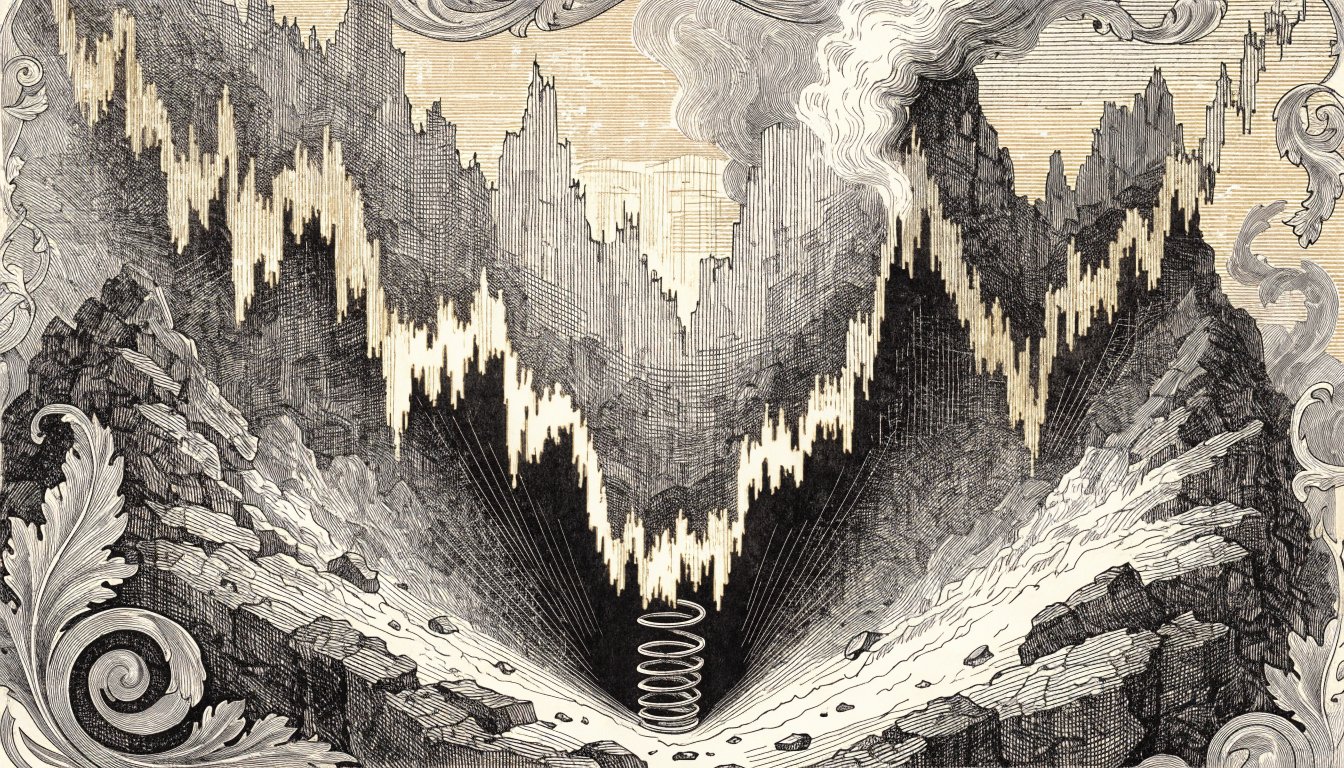 Chart Patterns
The double bottom is a bullish reversal pattern that prints when a downtrend stops working. Price drops into a support level, bounces, comes back to the same zone,…
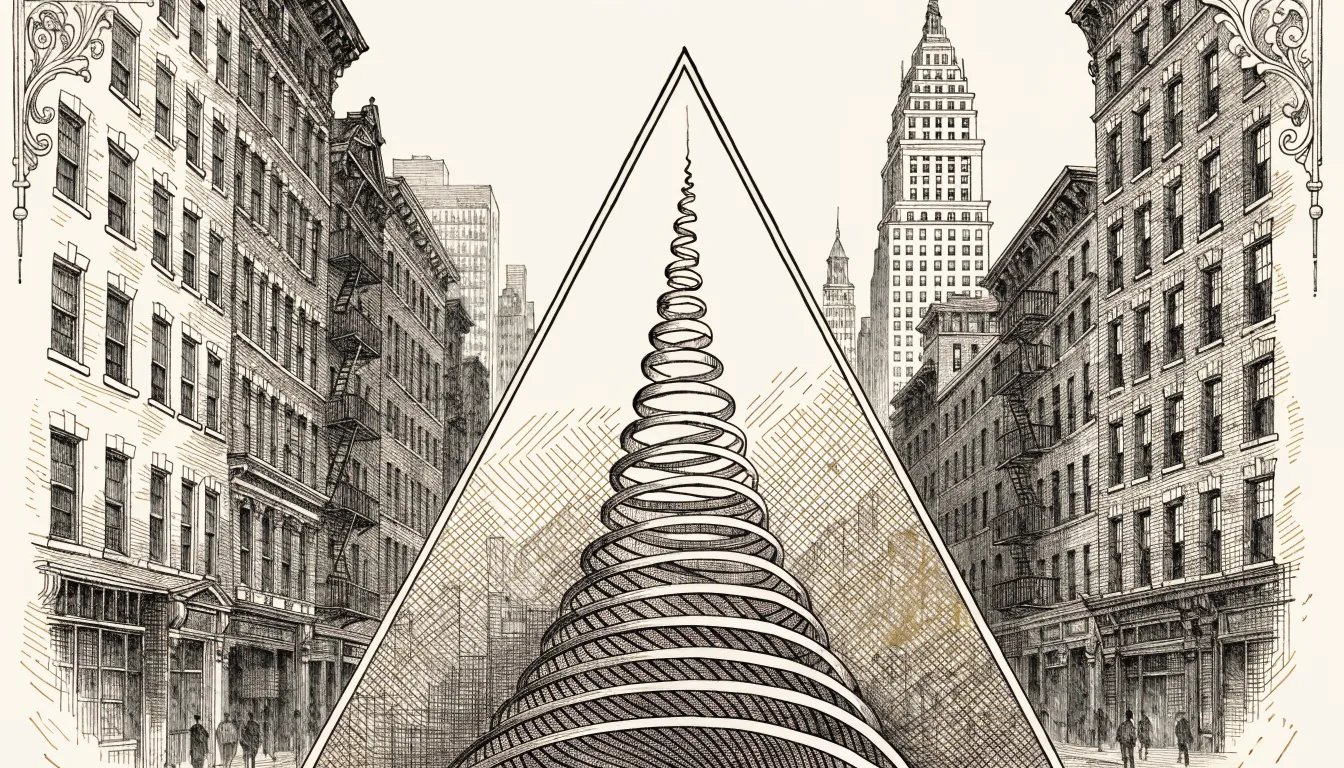 Chart Patterns
Triangles are coiling patterns. Price gets squeezed between two trendlines that converge on each other, volume bleeds out of the tape, and at some point the pressure has…
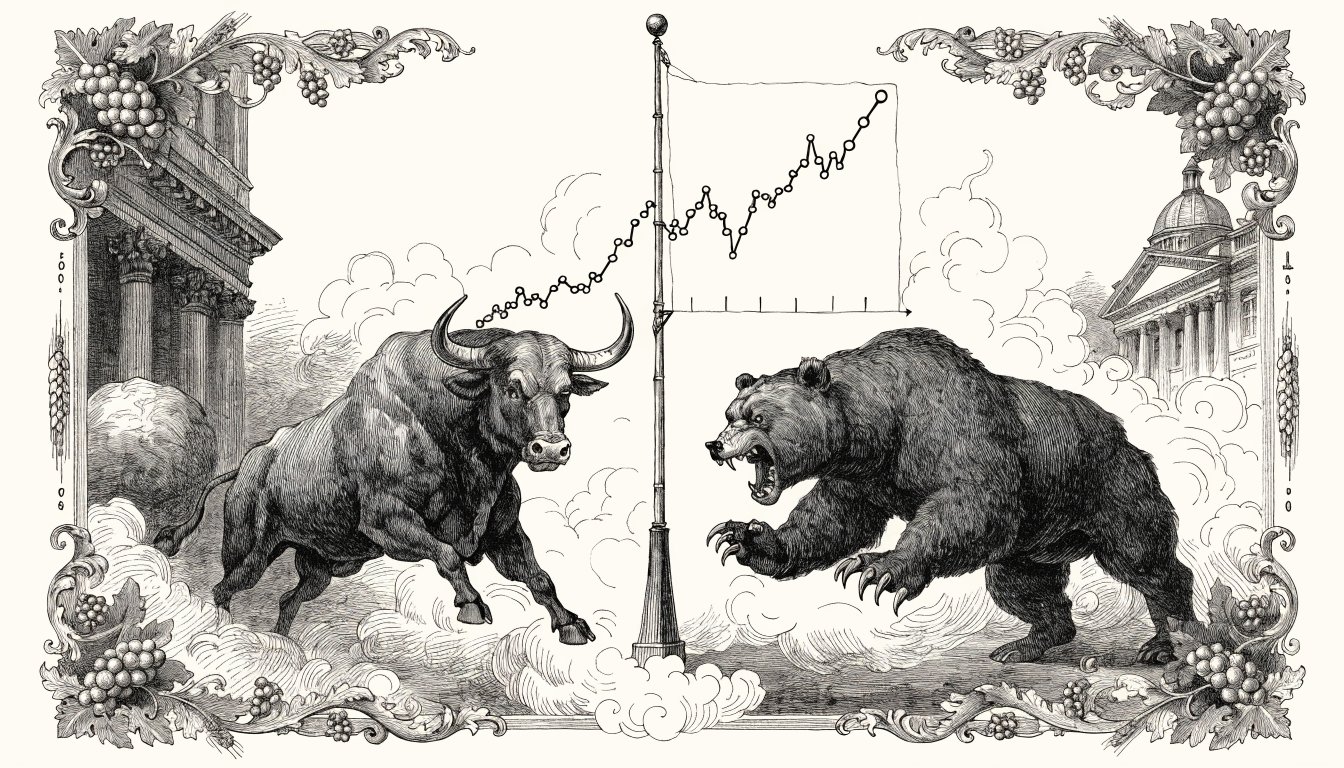 Chart Patterns
NVDA, August 2023. The stock had ripped from 420 to 480 in eight sessions on the back of the Q2 print. Then it stopped. For nine trading days…