The Framework
Before buying any stock, the analyst should work through the sequence below. For large-cap NYSE and NASDAQ issuers, most of the relevant information is publicly filed and accessible on the regulatory record. For penny stocks and OTC names, portions of that record are frequently missing, and the absence is itself evidentiary — it tells the analyst something about governance, disclosure culture, and the conditional probability of unpleasant surprises in the quarters ahead. The working principle is that an issuer whose financial condition cannot be reconstructed from the public filings is not, for our purposes, an issuer one can rely on.
1. The Business
This step sounds trivial and generally is not. An investor who cannot describe the business model in two or three sentences — what the company sells, to whom, at what margin, and why the customer returns — does not understand the business well enough to own it. The 10-K annual report is the principal source. Item 1, “Business”, and Item 1A, “Risk Factors”, are in practice more useful than most sell-side material, because management drafted them under regulatory liability and had to be specific about what they were doing and what could go wrong. A useful exercise is to read Item 1A in isolation, before the financials; a meaningful fraction of investment errors would be avoided if the risk factors were treated as the document’s opening rather than its appendix.
2. SEC Filings
U.S. publicly traded companies are required to file periodic reports with the Securities and Exchange Commission. The filings that matter for ordinary due diligence are the following.
- 10-K — the audited annual report. Financial statements, MD&A, risk factors, business description. The principal document.
- 10-Q — the unaudited quarterly report. Interim financials and management commentary; useful for tracking progression between annual filings.
- 8-K — current report for material events: acquisitions, executive departures, material contracts, covenant breaches, auditor changes.
- DEF 14A — the annual proxy statement. Executive compensation, board composition, related-party transactions, and proposals subject to shareholder vote.
- Form 4 — insider transactions, filed within two business days of the trade date.
- S-1 / S-3 — registration statements for new issuance. An S-3 shelf registration is the standard mechanism by which a company signals it intends to sell additional equity within the next three years.
All of these are available without charge through the EDGAR database at sec.gov/edgar, searchable by ticker or issuer name, with the archive extending back roughly two decades for most filers. A company that does not file with the SEC — not uncommon on the Pink Sheets — should generally be treated as outside the opportunity set for investors who require verifiable financial information.
3. Financial Statements
Apply the fundamental analysis framework to the three statements. The questions below are not exhaustive, but they cover the diagnostics that determine whether the business is solvent and whether the equity is reasonably priced.
- Is revenue growing, flat, or declining, and on what organic versus acquired basis?
- Is the company earning an economic profit, or is reported net income flattered by non-cash items, one-time gains, or aggressive revenue recognition?
- What is the debt-to-equity ratio, and what is the interest coverage on operating earnings — ideally above 4× for a non-cyclical issuer, with the threshold tightening for cyclicals?
- Is free cash flow positive across the cycle, and how does the cumulative figure compare to cumulative reported earnings over the same period?
- How do the P/E, P/B, and EV/EBITDA multiples compare to peers and to the company’s own ten-year history, and what specific cash-flow trajectory would justify the current multiple?
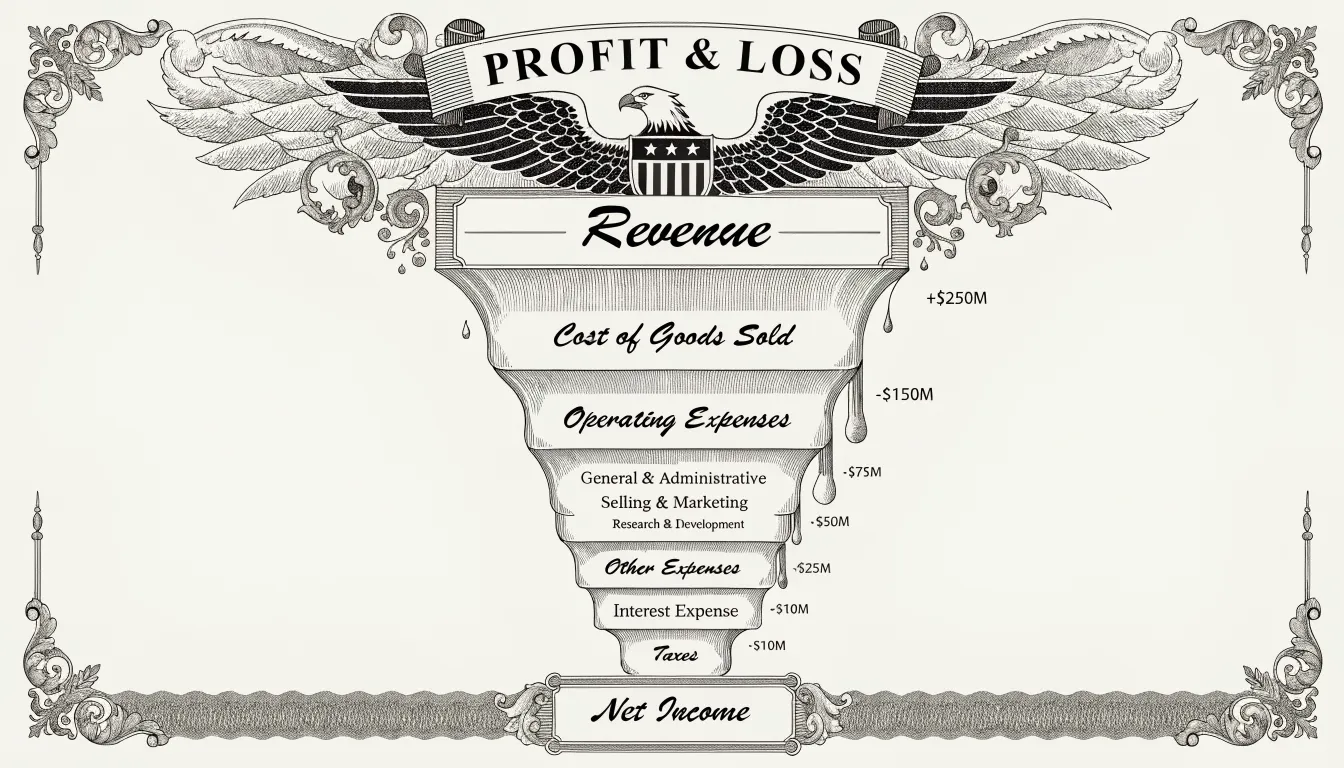
Net income is the most quoted figure on the income statement and, in isolation, one of the less reliable. Cash flow from operations, adjusted for maintenance capital expenditure — an estimate the analyst usually has to construct rather than read off the statement — is the more durable anchor for valuation work. Where reported earnings and operating cash flow diverge persistently, the divergence is the analytical question, and the answer is rarely flattering to the issuer.
4. Share Structure
Share structure is a standard line item for institutional analysts and a recurring blind spot for retail investors, particularly in the small-cap and penny-stock tiers where dilution risk is highest. The relevant figures are:
- Shares outstanding — total shares issued and held.
- Float — shares available for public trading, equal to shares outstanding less restricted and insider holdings. A small float generally produces higher realised volatility and wider bid-ask spreads.
- Authorized shares — the ceiling set by the corporate charter. Where authorized shares run substantially above issued shares — a 10:1 ratio is a commonly cited warning threshold — the infrastructure for dilution is already in place and requires no additional shareholder approval to deploy.
- Recent issuance — review the cash flow from financing section and any outstanding S-3 shelf registration. These disclose explicitly whether the company plans to access the equity market again, and on what scale.
When I covered financials at Fidelity in 2005, the senior analyst on the desk kept a one-page checklist that began with share count over the prior eight quarters. The working rule was that any issuer growing its share count faster than its operating earnings was, in the typical filing, transferring value from existing holders to new ones, and the burden of proof sat with management to demonstrate otherwise. The rule applied symmetrically: a 4% annual share-count reduction in a stable-margin business was treated as a meaningful component of total return, on roughly the same footing as a 4% dividend yield. I have not seen reason to revise either half of the rule.
5. Insider Activity
Insiders — executives, directors, and shareholders owning more than 10% — are required to report their transactions on Form 4 within two business days. The filings are public, indexed, and downloadable. Monitoring the record is one of the higher-yield inputs in retail-grade due diligence, because the reporting parties possess materially better information about the company’s condition and prospects than any outside analyst, and the regulatory regime forces them to leave a trail.
Insider buying on the open market, particularly concentrated buying by multiple insiders at similar price levels within a narrow window, is a meaningful bullish indicator. A chief executive committing several hundred thousand dollars of personal capital to ordinary common stock, at the prevailing market price and without the benefit of an option grant, is making an economically unambiguous statement — typically more informative than any sell-side note circulating at the same time. Insider selling is inherently ambiguous; insiders sell for tax reasons, for diversification, under scheduled 10b5-1 plans, and to fund the exercise of options, and a single transaction generally carries limited signal. Sustained, concentrated selling by multiple insiders over a short window, against the grain of a positive narrative, is the version that warrants attention.
6. Promotion and Information Hygiene
Stock promotion is the principal exogenous risk in the penny-stock segment and a non-trivial risk further up the capitalisation scale. The diagnostic markers are reasonably consistent across cases: paid email campaigns, newsletters, or research reports recommending the stock, usually with compensation disclosed in small type at the bottom of the document; explicit disclaimers — “compensated $50,000 for distribution of this report” is the canonical language — which, when read carefully, establish that the communication is advertising rather than research; volume spikes unaccompanied by material news, filings, or visible operational change; and message-board accounts recently created, posting exclusively about one issuer in uniformly bullish terms, with thin detail on the underlying business.
A promoted price is, absent independent corroboration, an inflated price. When the compensation period ends, the price reverts. The pump-and-dump mechanic is well-documented in SEC enforcement actions and remains, on the available record, the most common single cause of catastrophic retail loss in the OTC tier — not because the mechanic is novel, but because the population of investors entering that tier turns over faster than the institutional memory of how it works.
The Abbreviated Review
A full due diligence process on a new issuer takes several hours of careful reading, and substantially longer in an unfamiliar industry. For situations where a name surfaces in conversation and a quick assessment is needed before deciding whether to investigate further, the following sequence covers the minimum.
- Read the business description on the company’s investor-relations page or the 10-K Item 1 — 2 minutes.
- Review the most recent financials: revenue trajectory, cash balance, total debt — 3 minutes.
- Examine share structure: outstanding, float, authorized — 3 minutes.
- Scan the most recent Form 4 filings for insider activity — 2 minutes.
- Screen for promotion: search the ticker together with terms such as “paid”, “compensation”, or “disclosure” — 2 minutes.
- Review the price chart for trend, volume patterns, and support and resistance — 3 minutes.
Fifteen minutes of disciplined screening will eliminate the worst candidates from consideration. It will not identify every winner, and it is not a substitute for the full analytical work on positions an investor actually intends to hold for a meaningful period. What the abbreviated review does is bound the downside by filtering out issuers whose problems are discoverable in the public record within a quarter of an hour — which, in the OTC segment, is a meaningful fraction of the population.
What the Framework Does Not Do
What this framework does not provide is a forecast. Due diligence reduces the probability of owning a fraud, an insolvent balance sheet, or a promoted shell; it does not tell the investor whether the stock will appreciate over any given interval, and conflating the two is a recurring source of error in retail practice. In chess terms, the discipline resembles the difference between the opening repertoire and the actual game: working through the framework establishes the position from which decisions can be made, but the decisions themselves remain to be played, and the strong positional player accepts that preparation bounds error rather than producing victory. The process is positional; the individual purchase decisions are tactical, and the two should not be confused.
I should add a concession here. The framework above is the version I was trained on and continue to apply, and there are categories of business — certain platform companies, certain capital-light compounders trading at multiples that the older value tradition would have refused on principle — where it has not, on the evidence of the past decade, produced fully adequate answers. The rules around share structure and cash flow remain robust; the multiples thresholds, less so. A reasonable analyst notes the limitation and continues to do the work, because the alternative — abandoning the framework on the strength of a regime that may or may not persist — has historically been the more expensive error.
The purpose of the work, in either case, is to ensure that when a position is taken, it is taken on the basis of the company’s actual financial condition rather than the narrative surrounding its ticker. The narrative will be there in either case; the financial condition is what governs the eventual outcome.
See also: Fundamental Analysis · Understanding Penny Stocks · Risk Management · Technical Analysis