The Four Parameters
Any bond, from a two-year Treasury bill to a thirty-year corporate debenture, can be specified by four parameters.
- Face value (par) — the amount the issuer repays at maturity. The standard denomination in the US corporate and Treasury markets is $1,000.
- Coupon rate — the annual interest, expressed as a percentage of face value. A 5% coupon on a $1,000 bond pays $50 a year, conventionally split into two semi-annual instalments of $25.
- Maturity — the date on which face value is returned. Convention divides the universe into short-term (one to three years), intermediate (three to ten), and long-term (ten to thirty).
- Yield — the actual return earned by the holder, which depends on the price paid. A $1,000 bond bought at par with a 5% coupon yields 5%. The same bond bought at $900 yields roughly 5.6%, because the $50 coupon is now received against a smaller capital outlay.
The distinction between coupon rate and yield is the most common point of confusion for new bond buyers. The coupon is fixed at issuance and printed on the indenture; the yield moves with the secondary-market price, and it is the yield that matters to anyone trading the instrument after the fact.
Categories
| Type | Issuer | Risk | Yield |
|---|---|---|---|
| US Treasuries | US federal government | Effectively zero credit risk (full faith and credit) | Lowest |
| Municipal bonds | State and local governments | Very low to moderate | Low (federal tax-exempt) |
| Investment-grade corporate | AA / A / BBB-rated companies | Low to moderate | Moderate |
| High-yield (junk) bonds | BB and below | Moderate to high | High (compensates for default probability) |
| International bonds | Foreign sovereigns and corporates | Variable; includes currency risk | Variable |
US Treasuries serve as the risk-free benchmark against which every other dollar-denominated bond is priced. The yield on any other bond is quoted, implicitly or explicitly, as a spread over the comparable Treasury. A corporate bond yielding 6% when the equivalent-maturity Treasury yields 4% is said to trade at a 200 basis point spread. The spread is the market’s assessment of the additional credit and liquidity risk involved in lending to the corporation rather than to the federal government — a judgement revised continuously, and not always calmly.
Price and Yield Move in Opposite Directions
The single most important mechanical fact in fixed income: bond prices and interest rates move inversely. When prevailing rates rise, the prices of existing bonds fall. When prevailing rates fall, the prices of existing bonds rise. The relationship is arithmetic; it is not a matter of sentiment or commentary.
Consider a bond paying a 4% coupon. If the Fed tightens and newly issued bonds of comparable risk and maturity yield 5%, no rational buyer will pay full price for the older 4% instrument. Its price falls until the implied yield to a new buyer matches the prevailing 5%. The reverse holds when rates decline: a 4% coupon outstanding becomes more attractive than newly issued 3% paper, and its price rises to a premium.
The magnitude of this price response scales with maturity. A thirty-year Treasury can lose 20% to 25% of its market value when long rates rise by two percentage points; a two-year Treasury, under the same shock, loses three to four percent. The technical term for this sensitivity is duration, and duration is the most important risk metric any bondholder has. Anyone who held long-duration Treasuries through 2022 has, by now, internalised the point at some cost (one imagines the lesson has been filed away, though institutional memory in fixed income is rather shorter than one might hope).
The Yield Curve
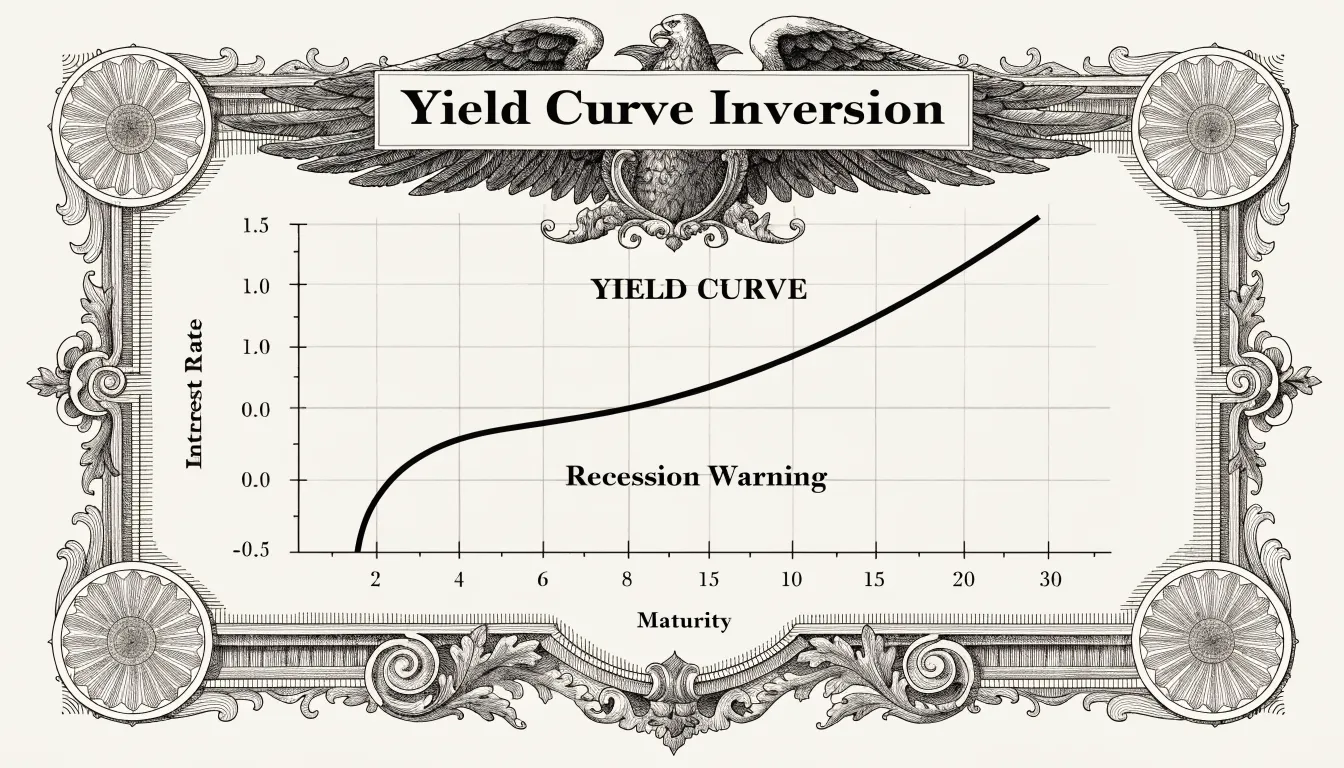
The yield curve is the plot of yields across maturities for bonds of identical credit quality — in practice, the Treasury curve. Under ordinary conditions, longer maturities pay higher yields, because lenders demand compensation for committing capital over longer horizons. The curve slopes upward.
When the curve inverts — short-term yields rising above long-term yields — the bond market is communicating an expectation that the Federal Reserve will be forced to cut rates within the medium term, which in turn implies anticipated economic weakness. An inverted curve has preceded every US recession since 1955. It is the most reliable single recession indicator in the empirical macro literature, with the caveat that the lag between inversion and recession has run anywhere from six months to two years. That is a wide enough window to embarrass anyone who treats the signal as a trading instruction rather than a probability statement.
Why Equity Investors Watch the Bond Market
Bonds and stocks are connected through several distinct channels, each of which matters for equity valuation.
- Direct competition for capital. When the ten-year Treasury yields 5%, an investor can earn a substantial real return with no equity market risk. Capital migrates out of stocks and into fixed income, compressing equity multiples. When Treasuries yield close to zero, equities become the default destination for return-seeking capital — the so-called TINA effect (There Is No Alternative) that characterised the post-2008 and pandemic-era allocation environment.
- The discount rate channel. The theoretical price of a stock is the present value of its future cash flows, discounted at a rate built up from the risk-free Treasury yield plus an equity risk premium. Higher Treasury yields mechanically raise the discount rate, which mechanically lowers the present value, which mechanically lowers the appropriate stock price. This channel was the principal driver of the 2022 equity drawdown, and the long-duration tech complex absorbed most of the damage for the obvious arithmetic reasons.
- The information content of bond prices. The Treasury and high-grade corporate markets are dominated by institutional participants — pension funds, insurers, sovereign wealth funds, central banks — who collectively employ more credit analysts than the equity market employs sell-side strategists. When the bond market is pricing one outcome and the stock market another, the bond signal is, by and large, the more informed of the two.
- High-yield as a risk gauge. Junk bond spreads widen as default probabilities rise, and they tend to widen before equity weakness becomes obvious. The HYG-Treasury spread, or any of the standard high-yield indices, is a useful contemporaneous indicator of credit conditions and tends to move first.
Bond ETFs as Practical Exposure
Direct purchase of individual bonds is operationally cumbersome for retail accounts — minimum lot sizes, dealer markups, and liquidity gaps make it rather harder than it sounds. Bond ETFs provide diversified, liquid fixed-income exposure tradeable on the equity exchanges:
- TLT — 20+ year US Treasuries. High duration; large price moves on long-rate shifts. Frequently used as a hedge against equity drawdowns, on the premise that flight-to-quality bids Treasuries when stocks sell off — a relationship that held in 2008 but broke down in 2022.
- AGG — Bloomberg US Aggregate Bond index. Broad exposure to Treasuries, agency mortgages, and investment-grade corporates.
- HYG — High-yield corporate bonds. The product trades with a higher correlation to equities than to Treasuries; in practice, it is a credit-risk product wearing a fixed-income label.
- TIP — Treasury Inflation-Protected Securities. Principal indexed to CPI; provides explicit protection against inflation, with the usual caveats about the CPI basket.
Bonds Within a Portfolio
The traditional 60/40 portfolio — sixty percent equities, forty percent investment-grade bonds — was the default institutional and retail allocation for most of the postwar period. The premise was diversification: in equity drawdowns, Treasuries would rally on flight-to-quality flows, and the bond sleeve would partially offset stock losses. During the 2008 crisis, the long Treasury sleeve gained more than 20% while the S&P 500 declined by more than 50%. The cushion was substantial.
The 60/40 logic was tested in 2022, when both stocks and bonds declined together as the Federal Reserve raised the federal funds rate from near zero to above 5% in roughly eighteen months. Correlations between the two asset classes turned positive for the first sustained period in more than two decades, and the 60/40 had its worst real-return year since 1937. The diversification premise of the allocation depends on the inflation regime; when inflation is the dominant macro shock, stocks and bonds sell off together. That is a regime feature, not an anomaly, and the episode will, in due course, be repeated.
For an active equity trader, a 40% bond allocation is generally too defensive. A reasonable working compromise is a 10% to 20% allocation to short and intermediate-duration bond ETFs, which earns a positive real yield in current conditions while preserving capital between trading opportunities. The point is not to time the bond market — that is a separate discipline, and a difficult one. The point is to keep idle capital from earning nothing, which is the easiest unforced error in retail portfolio management and, on the evidence, also the most common.
See also: The Federal Reserve and Interest Rates · What Is Inflation? · ETFs · What Is a Bear Market? · The 2008 Financial Crisis