 Technical Analysis
Bollinger Bands: Volatility, Squeezes, and Trading Signals
Bollinger Bands are a volatility envelope wrapped around a 20-period simple moving average. The upper and lower lines sit at ±2σ of the closing-price…
3 articles tagged “chart indicators”.
Technical Analysis
Bollinger Bands are a volatility envelope wrapped around a 20-period simple moving average. The upper and lower lines sit at ±2σ of the closing-price…
 Technical Analysis
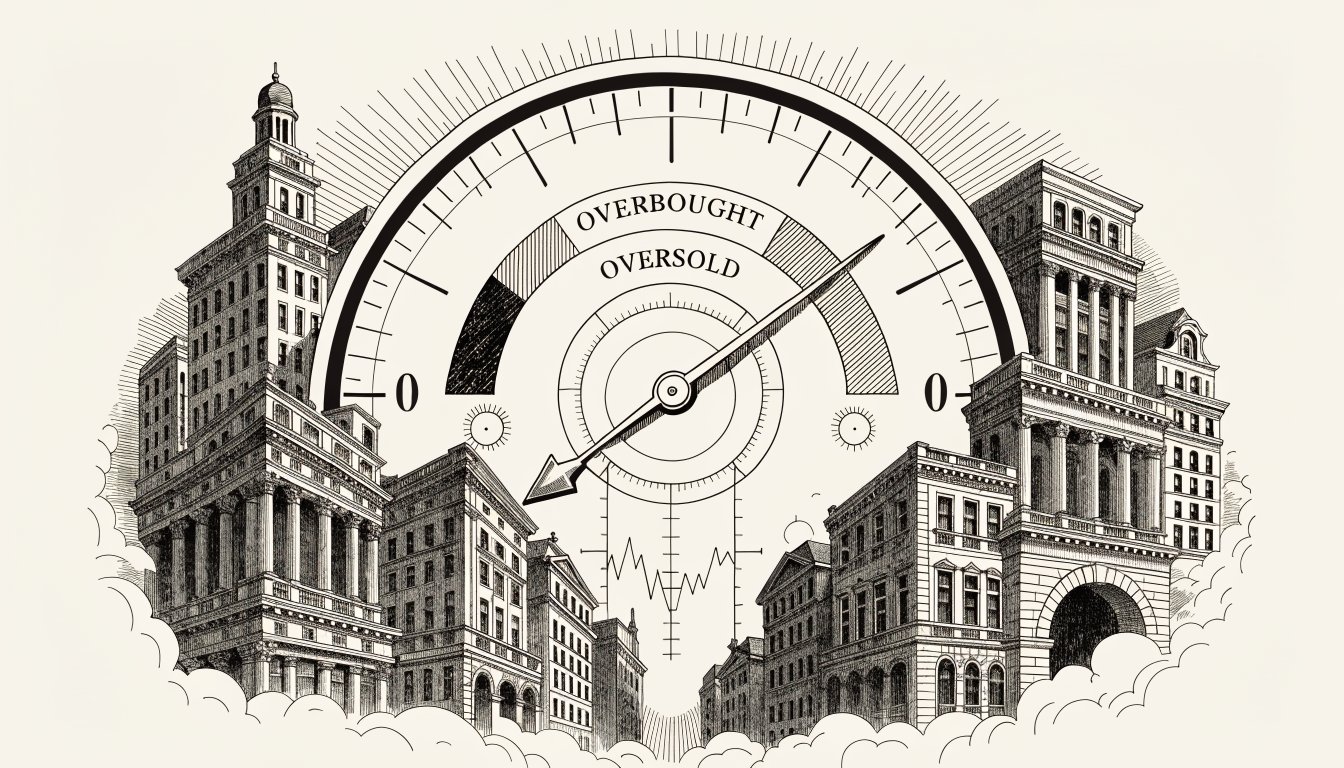
The Relative Strength Index (RSI) is a momentum oscillator J. Welles Wilder Jr. built in 1978 to measure the speed and magnitude of recent…
 Technical Analysis
AAPL, late May 2023. The stock had been riding above its 20-day EMA for six straight weeks, pulling back to tag the line twice…