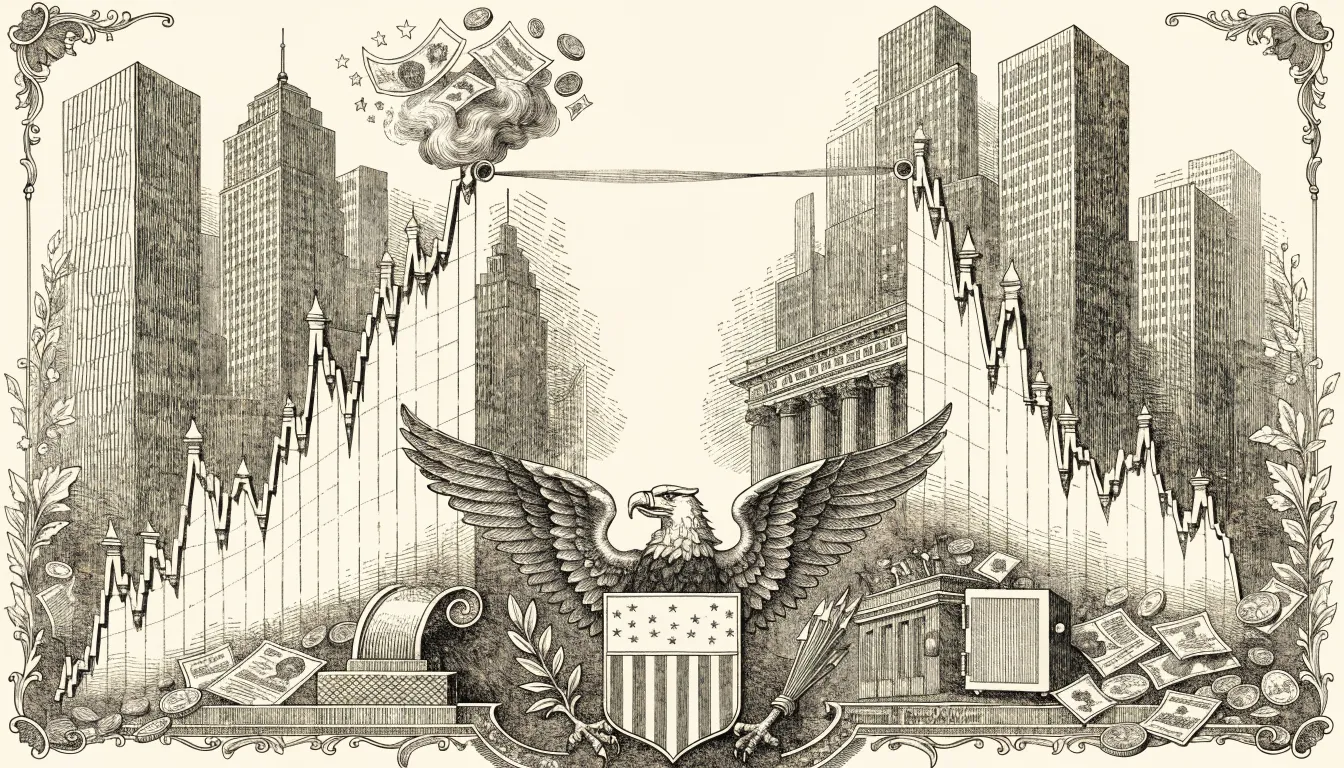
Price and Value Are Not the Same Number
The intellectual core of the discipline is the separation of two figures that most participants treat as synonyms. Price is a quoted number, set continuously by the marginal buyer and seller, and it carries the full weight of sentiment, liquidity conditions, momentum, tax-year effects, and a great deal of unrelated noise. Value is an estimate of the present worth of the cash a business will distribute to its owners over its remaining life, adjusted for the risk that those distributions will not occur as expected. The first is observed; the second is computed, and computed with material uncertainty. The two figures are usually close, because in efficient corners of the market a great many analysts converge on similar estimates and arbitrage the gap. Periodically — in sector panics, in indiscriminate selloffs, in stocks that have fallen out of institutional favour for non-fundamental reasons — the divergence widens to a point where the margin of safety becomes large enough to commit capital.
Graham’s parable of Mr. Market, developed at length in the Graham article, is the standard formulation. The market is a partner who quotes a price every business day, and the analyst is free to transact at that price or to ignore it entirely. The parable is taught everywhere and accepted almost nowhere — by which I mean very few practitioners actually behave as if the daily quote and the underlying value are independent processes. They are. The difficulty of internalising that separation is, broadly speaking, most of the reason the strategy continues to produce excess returns despite being publicly documented for nearly a century.
Quantitative Screens for Mispricing
Practitioners use several rough screens to identify candidates for further fundamental work. None is sufficient on its own; each is a trigger for the analytical effort that follows. The screen produces a candidate; the file decides the position.
Low Price-to-Earnings
The price-to-earnings ratio remains the most durable rough screen in equity research, despite its well-documented weaknesses. A trailing P/E of 8.0× means the buyer is paying eight dollars for every dollar of last year’s reported earnings, which is reasonable if those earnings are representative and unreasonable if they are not. The S&P 500 has historically traded in a 15-17× range on trailing earnings, with substantial cyclical variation around that mean. A stock priced significantly below the index average, or below its own historical range, warrants investigation. The investigation typically resolves one of two ways: either the cheapness reflects a deterioration the market has correctly identified, in which case the analyst declines, or the cheapness reflects an over-extrapolation of recent disappointment, in which case the analyst is interested. Distinguishing the two cases is the actual work of the discipline.
Low Price-to-Book
The price-to-book ratio compares market capitalisation to the accounting net asset value of the company. A P/B below 1.0 means the buyer is paying less than the reported liquidation value of the assets, which Graham regarded as the most analytically robust value criterion when applied to companies whose book values were composed of identifiable, marketable assets. The screen has weakened materially since Graham’s era because a growing share of corporate value resides in intangibles — brand, software, network effects, organisational capital — that GAAP either understates or omits. A modern P/B below 1.0 in a financial, an industrial, or a real-asset business still merits work; the same metric on a software company is essentially uninformative. Knowing which case is in front of you is the analyst’s task, not the screen’s.
Sustainable Dividend Yield
A dividend yield meaningfully above the market average can indicate undervaluation when paired with a long record of paid and growing distributions and a payout ratio that leaves room for reinvestment. A yield above roughly 8-10%, absent an explanation rooted in capital structure or one-time events, generally signals that the market expects a cut and is pricing the security accordingly. The rough check is to compare the dividend to free cash flow rather than to reported earnings, since earnings can be flattered by accruals while distributions cannot be paid out of accruals indefinitely.
Low Price-to-Free-Cash-Flow
Free cash flow — operating cash flow less the capital expenditure required to maintain the existing earnings base — is harder to manipulate than reported net income, though not impossible. A multiple of free cash flow below approximately 10×, in a business whose cash generation is stable or growing, is a stronger signal than a comparably low P/E because the underlying number is closer to the economic reality the discounted-cash-flow framework is trying to capture. Klarman, in Margin of Safety, devotes substantial attention to the gap between accounting earnings and what an owner can actually withdraw from the business, with extended treatment of working-capital adjustments, maintenance versus growth capex, and the kinds of non-cash charges that flatter or depress GAAP figures relative to owner cash. The gap is sometimes small and sometimes very large, and the analyst needs to know which before paying any particular multiple.
Margin of Safety as a Working Procedure
The margin of safety is not a slogan. It is a working procedure that determines what price the analyst is willing to pay after the qualitative work has been done, and the procedure has three parts applied in sequence rather than in parallel. The sequence matters, because reversing it produces motivated reasoning rather than analysis.
The first task is to estimate intrinsic value within a range. A point estimate is rarely defensible; a range bounded by a conservative case and a more optimistic case is. The analyst constructs the range using some combination of earnings multiples on normalised earnings, book or replacement-cost values where relevant, discounted cash flow on owner earnings, and comparable transaction multiples. The conservative end of the range is what governs the buy decision; the optimistic end governs the price at which one might trim, and is otherwise of limited operational use.
What follows is the discount. Graham required at least a 33% reduction from conservative intrinsic value for ordinary common-stock purchases, and substantially more for businesses he considered speculative. Buffett, in his post-1972 phase following the Munger revision, became willing to accept narrower discounts in exchange for higher business quality, on the theory that compounding at high rates of return on capital eventually overwhelms the entry price. The See’s Candies acquisition of 1972, paid for at roughly $25M against approximately $4M of after-tax earnings, was the case Buffett returned to in subsequent letters as the working illustration of the trade-off. Both formulations are defensible; both depend on the analyst being honest about which case actually applies, and the honest answer in the typical file is the Graham case rather than the See’s case.
Then one waits. The market may take quarters or years to revise its estimate. The waiting is where the strategy fails for the typical practitioner, not the analysis. A reasonable estimate of value is a perishable asset only if conviction is lost, and conviction is generally lost not because the facts change but because the price action induces doubt about the facts.
This is the part of the discipline I find consistently underappreciated by writers describing it from the outside. The arithmetic of margin of safety is taught in a single afternoon. The behavioural prerequisite — sitting on a position that is moving against the analyst for eighteen months while continuing to verify that the original thesis remains intact — is essentially never taught, because it cannot really be taught in writing. It is acquired, slowly and expensively, through the experience of being wrong about timing while being right about value, and learning to distinguish those two errors. When I covered financials at Fidelity in 2005, the senior analyst on the desk had a working rule about value positions: if you cannot say what you would do in the seventh consecutive month of underperformance, you do not yet own the thesis, you only own the price. I have not seen reason to disagree. The rule is not elegant and it is not original, but it foreclosed a category of error I had previously made repeatedly.
Value and Momentum as Different Lenses
Value investing and the momentum-oriented strategies discussed elsewhere in this guide are not in opposition so much as different time horizons addressing different mispricings. The value investor buys assets the market has marked down below their durable economic worth and accepts that the recovery may be slow. The momentum trader buys assets the market is in the process of revaluing upward and accepts that the revaluation may exhaust itself abruptly. Each approach is exposed to its own characteristic error: the value investor catches falling knives, purchasing securities that are cheap because the underlying business is genuinely impaired; the momentum trader buys near tops, entering trends in their final phase. Neither error is a defect of method; both are the residual the method does not eliminate.
In practice, the due diligence process required to support either approach overlaps more than the styles’ rhetoric suggests. The value investor benefits from at least a passing awareness of the technical posture of a stock before committing capital, if only to time the entry less ineptly. The momentum trader benefits from at least a basic check on financial solvency and earnings quality, since the worst momentum reversals tend to occur in businesses whose fundamentals were already deteriorating before the price confirmed it. The two traditions disagree about the principal source of return; they need not disagree about the value of doing the homework, and the more rigorous practitioners on either side eventually arrive at a hybrid posture that concentrates capital in a small number of positions where the fundamentals have been verified and the price posture is at least not actively hostile.
The Empirical Record
Value investing has the longest and most thoroughly documented track record of any disciplined approach to public equities. The Graham-Newman Fund compounded at roughly 17% annually from 1926 to 1956, a span that includes the Great Depression, the Second World War, and the post-war reflation. Buffett’s partnerships returned 29.5% annually from 1957 to 1969 with no losing year. Berkshire Hathaway has compounded book value per share at approximately 21% annually since 1965. The Washington Post position purchased in 1973 at roughly $10.6M, against a private-market value Buffett estimated at $400M for the underlying enterprise, eventually compounded into a multi-billion-dollar holding over thirty years; the Coca-Cola purchase concentrated through 1988 at approximately 15× earnings produced a five-fold appreciation over the subsequent decade. Klarman, Greenblatt, Marks, Li Lu, and a number of less publicised practitioners have beaten relevant benchmarks over horizons measured in decades.
The consistency of the outperformance across very different practitioners, sectors, and macro regimes is unusual in finance, where most apparent edges turn out to be either artefacts of the test or arbitraged away within a decade of being documented. The methodological standard for accepting a value premium — replication across independent samples, across non-overlapping time periods, across research teams with no shared dataset — has been cleared to an unusually clean degree. Fama and French formalised the size and value factors in the early 1990s; the underlying observations go back at least to Basu in 1977; the effect has been re-derived on international samples covering markets the original authors did not study. The premium has had notable drawdowns — particularly the 2010-2020 decade, when classical value underperformed badly relative to growth — and whether that decade represents permanent regime change or a long mean-reverting episode is, in the available evidence, not yet resolved. The honest position is that I do not know, and analysts who claim certainty in either direction are making claims their data cannot support.
The persistence of the edge despite its public documentation is the part that requires explanation, and the most credible explanation is behavioural rather than analytical. The discipline requires buying when peers are selling and waiting when peers are trading, and these are not skills that scale with intelligence or with information access. They scale with temperament, which is durably scarce. Marks has written about this in his Oaktree memos at greater length and with more clarity than I can reproduce here; the short version is that the edge persists because the qualifying conditions are uncomfortable, and uncomfortable qualifying conditions tend not to be arbitraged away. In chess terms, the analogy that fits is the technique of converting a small endgame advantage. The position contains the win, but converting it requires the player to make twenty correct moves in succession against an opponent who is also looking for a single mistake. Most practitioners do not lose the value game by misjudging the entry; they lose it by failing to convert — by selling the position in month nine for reasons that are not actually about the position. The endgame, not the opening, is where most of the documented results were earned.
What This Method Does Not Do
It does not produce smooth returns. The drawdowns of disciplined value funds in 1973-1974, 1999-2000, 2008-2009, and 2018-2020 were severe, and the recovery in each case took longer than the popular literature implies. It does not protect against being wrong about the underlying business; a margin of safety bounds the error but does not eliminate it, and concentrated positions in deteriorating businesses can produce permanent losses regardless of how cheap they appeared at purchase. It does not work on the time horizons retail investors typically have, which are measured in months rather than the multi-year windows over which the historical results were generated. In the language of endurance running, this is not a sprint event — the splits in the early miles are usually unflattering and the time, when it is made up at all, is made up in the back half. The runners who hold the discipline through a slow opening tend to be the runners who finish; the runners who try to compensate for a slow opening by accelerating in the middle miles tend to blow up at twenty.
What the method provides is a framework in which errors are bounded and the analyst can articulate, before committing capital, what would have to be true for the position to fail. That articulation is most of what discipline, in this practice, actually means. The harder question is whether the temperament the strategy presupposes is genuinely available to the typical practitioner, or whether it is, in the working investor population at any given time, distributed too thinly to be reliably acquired by reading about it. Readers interested in the lineage can review the Graham, Buffett, and Munger articles for the biographical context in which these ideas were developed, and the Fundamental Analysis and due diligence articles for the procedural detail this one has summarised rather than reproduced.
See also: Benjamin Graham · Warren Buffett · Fundamental Analysis · What Are Dividends?