The Statistical Object
Assuming returns are approximately stationary over the chosen lookback window, the price series can be summarised by a mean μ and a standard deviation σ. The z-score, z = (Pt − μ) / σ, measures how many σ the current price sits from the mean. The mean-reversion claim is empirical: conditional on |z| above some threshold (commonly 2), the expected next-k-day return carries the opposite sign of z, and the effect size is large enough to survive transaction costs.
The S&P 500 cash index gives the standard calibration. After a 3-day decline of 3% or more, the next 5-day return is positive in roughly 65% of historical instances. After a 3-day rally of 3% or more, the next 5-day return is negative in roughly 55%. Neither number is overwhelming. Over hundreds of trades, with disciplined sizing, the asymmetry between 65% and 55% is itself a regime statement: equities have an upward drift, so shorting strength fights the tape and buying weakness does not. The expected-value gap between the long and short side of a symmetric mean-reversion engine is, to a first approximation, exactly the equity risk premium expressed at short horizons.
Measuring the Deviation
Three statistics, each capturing a slightly different definition of stretched.
RSI Extremes
The Relative Strength Index is a bounded oscillator on [0, 100], computed from the ratio of average up-closes to average down-closes over a lookback (default 14 periods). Conventional thresholds: RSI below 30 reads oversold, below 20 extremely oversold; RSI above 70 reads overbought, above 80 extremely overbought. The RSI(2) variant, popularised by Larry Connors, treats RSI(2) < 10 as the entry trigger for short-horizon mean reversion. Shorter lookbacks generate more signals at higher per-signal information content, but require tighter execution and pay more in slippage.
RSI is not regime-aware. In a strong trend, RSI can pin above 70 for weeks, and a mean-reversion entry on that reading is a structural short against a drifting market. The indicator does not know the difference between a stretched range-bound tape and a trending one. The trader has to.
Bollinger Band Extremes
Bollinger Bands are a 20-period moving average flanked by ±2σ envelopes computed from the same window. Under the stationarity assumption, roughly 95% of observations fall inside the bands; a touch of the lower band is therefore a tail event — under the assumption. That assumption is the first thing to fail when a regime change is in progress. Mean-reversion entries at the lower band work when the bands are flat or contracting (range-bound regime). They fail systematically when the bands are expanding (volatility breakout regime). Same indicator, opposite expected return, conditional on the regime.
Distance from Moving Average
The simplest measure: percent deviation from a 20-day or 50-day moving average. A stock 8% above its 50-day MA is stretched; one 10% below is deeply stretched. The threshold for “deep” is name-specific and should be calibrated from the historical distribution of |P − MA| / MA for that ticker. A 5% deviation is meaningful for a low-vol consumer staple and trivial for a high-beta growth name. Using a single fixed threshold across a universe of mixed volatilities is a common backtest mistake: the trades cluster in the high-vol names, and the strategy turns out to be a vol-premium harvester wearing a mean-reversion costume.
Entry Mechanics
A reasonable systematic specification, written as the rules a script would execute against an end-of-day data feed.
Screen: RSI(2) < 10 OR RSI(14) < 30, AND close below the lower Bollinger Band, AND price more than 5% below the 20-day SMA. All three filters must trigger before the name enters the candidate pool.
Confirmation: do not enter on the day the screen first triggers. Wait for the first session whose close exceeds its open after the oversold reading. This is a noisy proxy for “selling pressure has paused,” but it cuts the worst entries — names still distributing on the day they first print oversold. The cost of waiting is missed bounces. The benefit is fewer falling-knife attempts. Which side of that trade-off has positive expected value depends on the regime.
Entry: at or near the next session’s open after the confirmation candle.
Stop: a tick below the lowest low of the prior 5 sessions, or 2σ below entry, whichever is closer. If price violates the stop, the mean-reversion thesis has been falsified at the chosen horizon. Exit. There is no point negotiating with a falsified hypothesis.
Target: the 20-day SMA. By construction, that is where the rubber band is at rest. Take profit at the target or trail a stop once price reaches it. Holding past the mean is a bet on momentum, which is a different trade with a different distribution and should be sized as such.
Regime Conditioning
This is the part that separates working strategies from backtests that look good on paper and bleed in production.
| Regime | Preferred Strategy | Mechanism |
|---|---|---|
| Strong uptrend | Momentum | Drift dominates. Pullbacks revert quickly but to higher means; pure mean reversion underperforms the trend. |
| Strong downtrend | Cash or short momentum | Bounces are short, shallow, asymmetric. Catching them is negative-EV after costs. |
| Range-bound | Mean reversion | The series is approximately stationary. Buying tail-low and selling tail-high is the textbook trade. |
| High-vol, choppy | Mean reversion | Stretched z-scores resolve quickly. Reversion-per-day is large; sizing must shrink to compensate. |
In Go, miai describes the situation where two moves are roughly equivalent in value: the opponent takes one, you take the other, and the count comes out the same. Regime-conditional strategy selection has the same structure. If the tape is trending, momentum is the move; if it is ranging, mean reversion is. Picking either and ignoring the other is fine, provided the regime cooperates. Picking the wrong one against the regime is not a missed opportunity; it is an active loss. Reading which board you are on is part of the trade, and a larger part of the long-run P&L than the entry rule itself.
The Rubber Band, More Carefully
The popular metaphor: price is a rubber band attached to the moving average; stretch is restoring force. The metaphor is approximately correct in range-bound regimes and breaks in two places.
A solo cyclist climbing a long grade has an analogous mechanic. After a hard above-threshold effort, cadence and power return toward a steady-state aerobic level — that is the mean reversion. But the restoring rate is not constant. It depends on glycogen, gradient, hydration, temperature; the same nominal effort produces a different recovery curve at hour one and hour four. Financial mean reversion behaves the same way: the half-life of reversion varies with vol regime and liquidity. A 2σ deviation in a calm 12-vol environment resolves in two or three sessions; the same deviation in a 30-vol environment can resolve in hours, or extend for weeks if the regime is genuinely shifting. Second break: rubber bands do not snap and walk away. Price series can. A 15% deviation is sometimes a stretched band about to recoil and sometimes the first leg of a new regime. Assigning probability to those two readings before sizing is the actual job.
Risk Management
Mean reversion is, by construction, the act of buying instruments that are falling. The thesis is that they will stop falling soon. The data say they usually do. The data also say they sometimes do not, and the loss distribution is left-tailed.
Position sizing should cap any single trade at 1–2% of portfolio risk, with the stop distance as the denominator, not the position notional. See position sizing. Averaging down is permitted only against pre-specified levels with pre-specified maximum total size; ad-hoc averaging on the rationale “even more oversold now” is the dominant mechanism by which small losses become large ones in this style. Modulo realised fills, the second add at a lower z is mathematically equivalent to a fresh trade with worse confirmation — treat it that way and the discipline survives contact with the screen.
Liquidity matters more than the strategy reads. Mean reversion in thin micro-caps is a different game: wide spreads consume edge directly, and the stop you specified at $9.50 fills at $9.05 when the book is empty at the trigger moment. Restrict the universe to names with ADV above some hard threshold — one million shares is a reasonable starting point, scaled up for size.
Holding period is short by design. If a trade has not reverted within roughly two weeks, the underlying assumption (stationary regime, stretched z-score) has likely been wrong. Exit and reallocate. Patience past the regime-validity horizon is not discipline. It is sunk-cost error in disguise.
Hybrid Entries Inside a Larger Trend
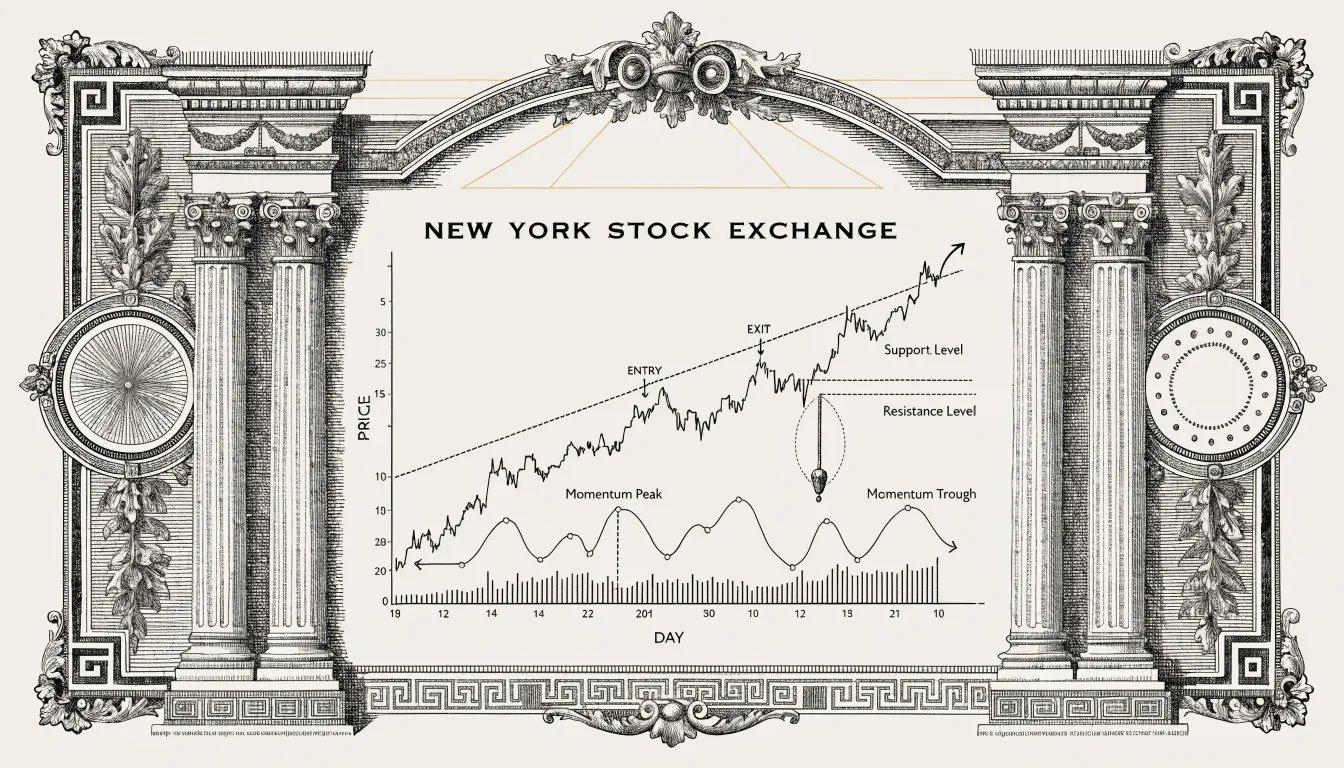
Pure mean reversion is one configuration. The more common usage in practice is a hybrid: mean-reverting entry mechanism, momentum-style holding thesis. The 50% Fibonacci retracement entry is exactly this object — wait for price to pull back toward the midpoint of the prior leg, then enter long under the assumption that the trend resumes from the retracement. Entries at support levels in a defined uptrend are the same idea expressed with horizontal levels rather than ratios.
This combination outperforms either pure approach in trending-but-noisy regimes, which describe most of equity-market history. The reason is mechanical: pure momentum pays a tax on entry slippage at the breakout; pure mean reversion gives back gains chasing reverts in a drifting market. The hybrid takes the cleaner entry of mean reversion and the longer hold of momentum, accepting that some retracements run deeper than 50% and stop out. The skill that does not show up in any indicator is the regime classification underneath: knowing which tool to pick up given the current state of the tape. Most of the alpha in either style is captured by that filter, not by the entry rule.
Model assumptions, to be explicit for this article: stationarity over the chosen lookback window, returns approximately log-normal at the daily horizon, transaction costs of order a few basis points per round trip, and execution at or near the quoted mid. None holds exactly. Conditional on the regime not breaking under the position, the expected-value math works. Conditional on it breaking, the loss is path-dependent and bounded only by the stop. Size for that.
See also: Momentum Trading: Riding the Trend · RSI: The Relative Strength Index · Bollinger Bands · Moving Averages Explained · Support and Resistance